2024-2025
CBS Heerlen
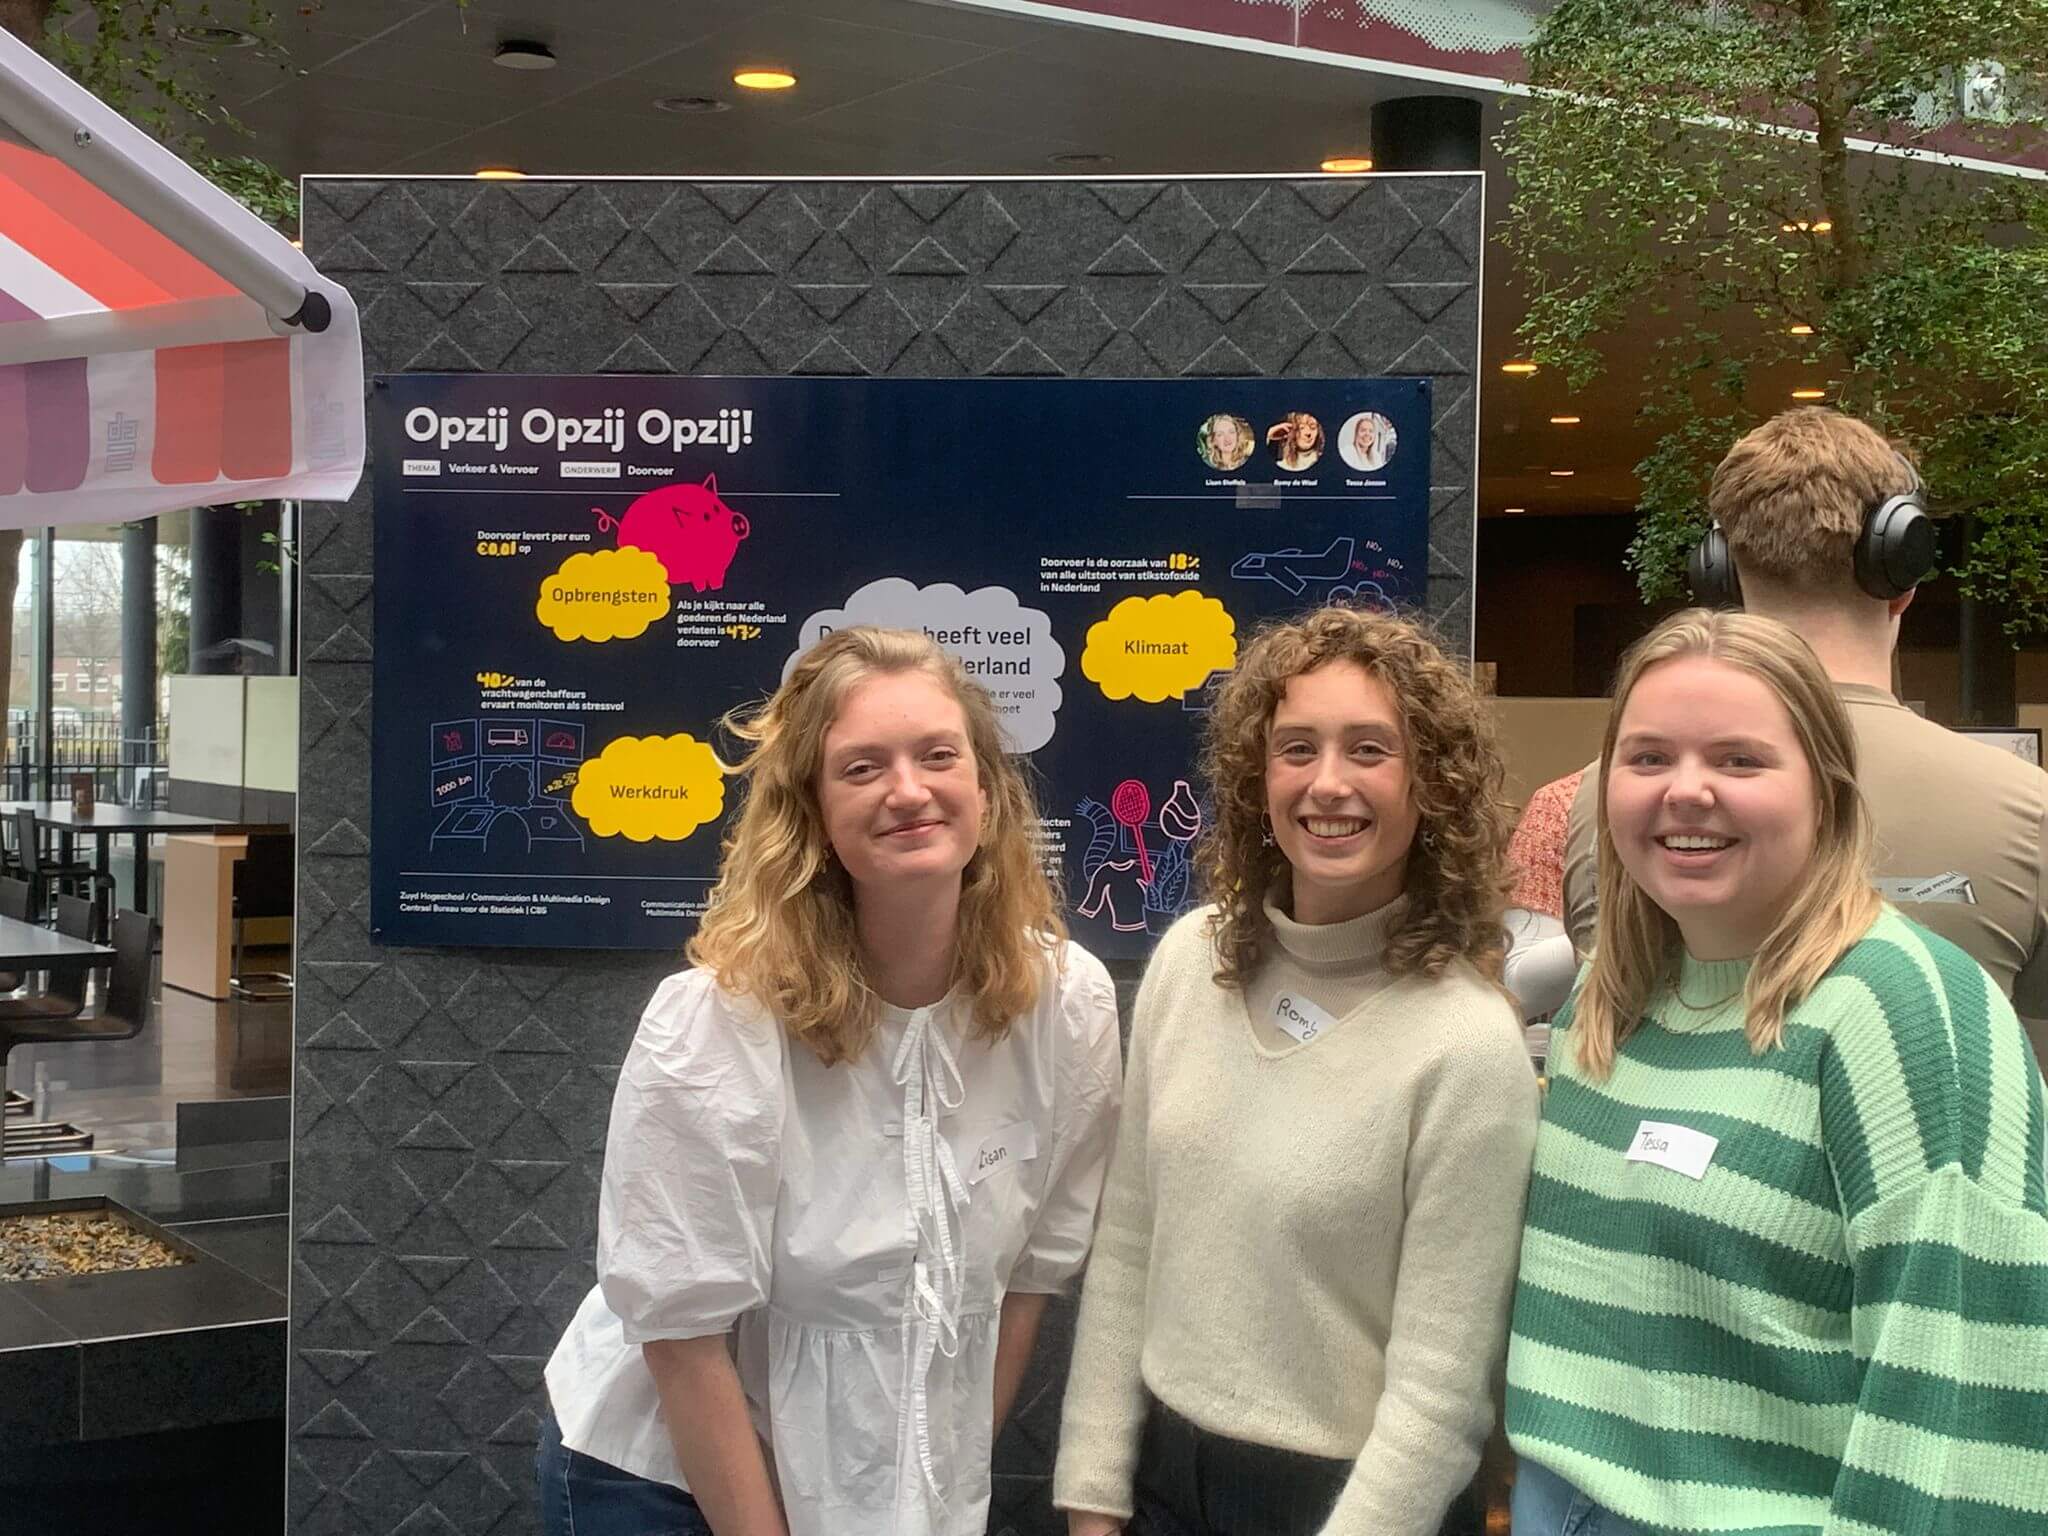
Tessa Janzen (designer) Lisan Stoffels (developer) and me (designer)
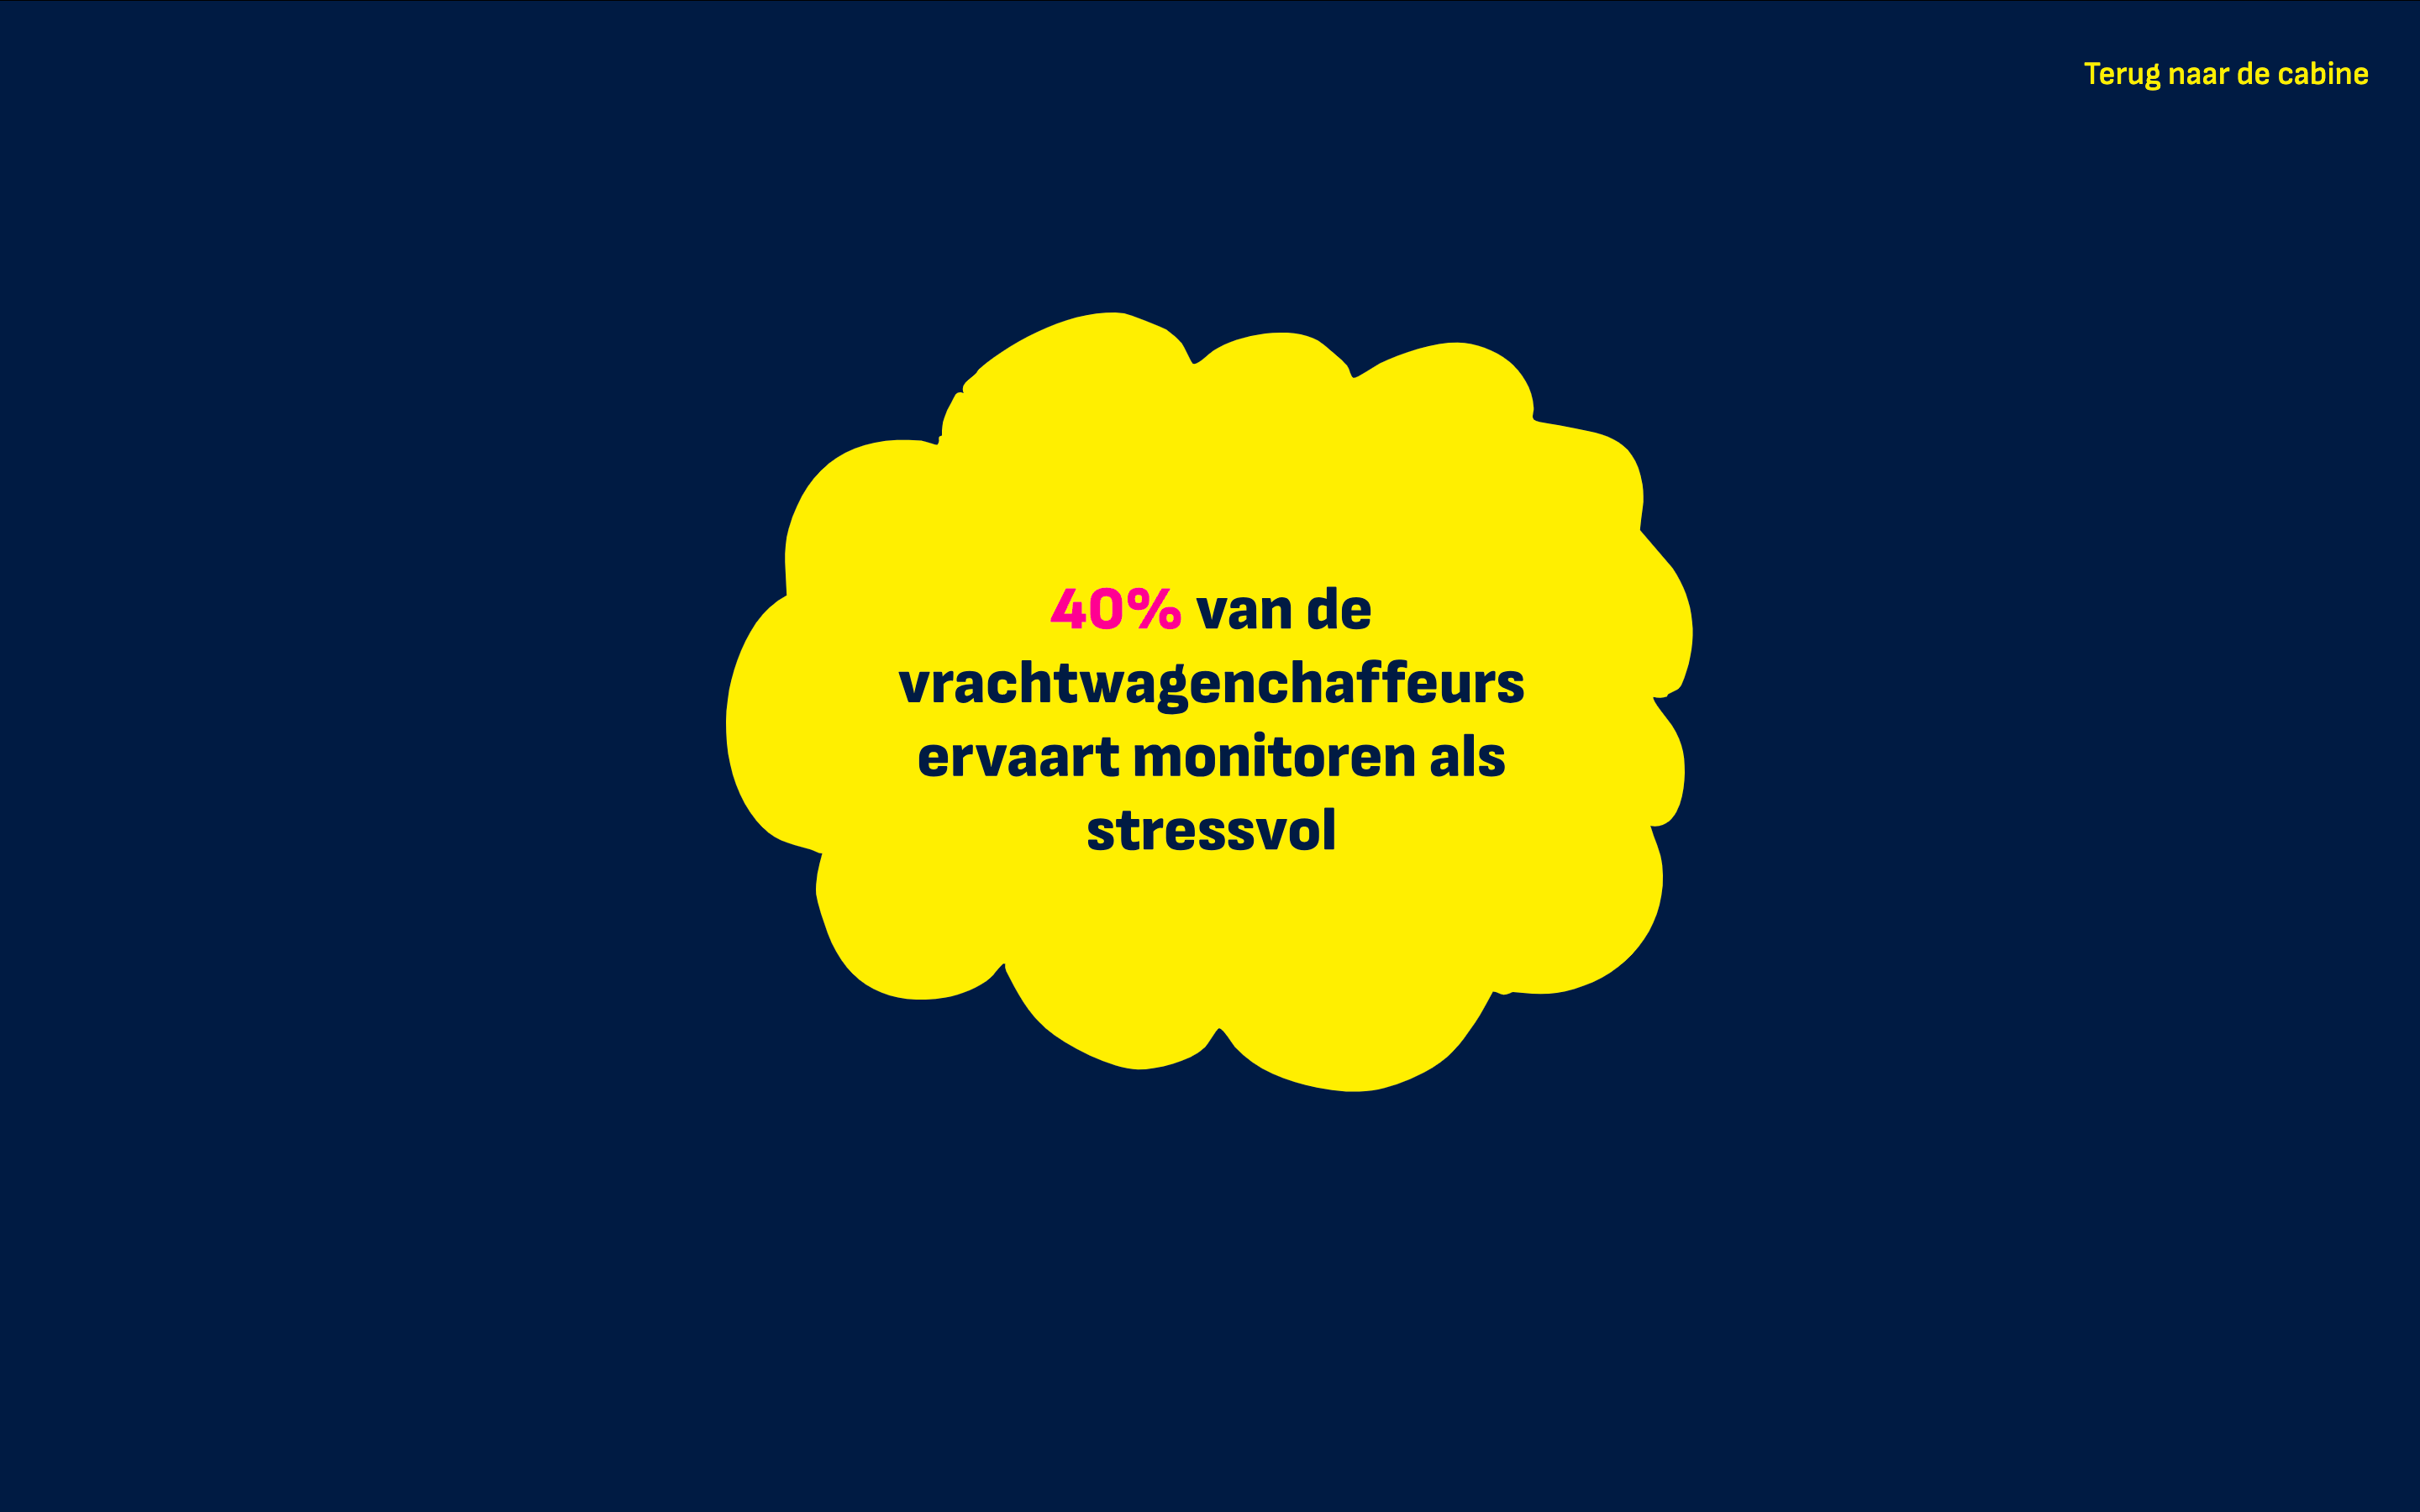
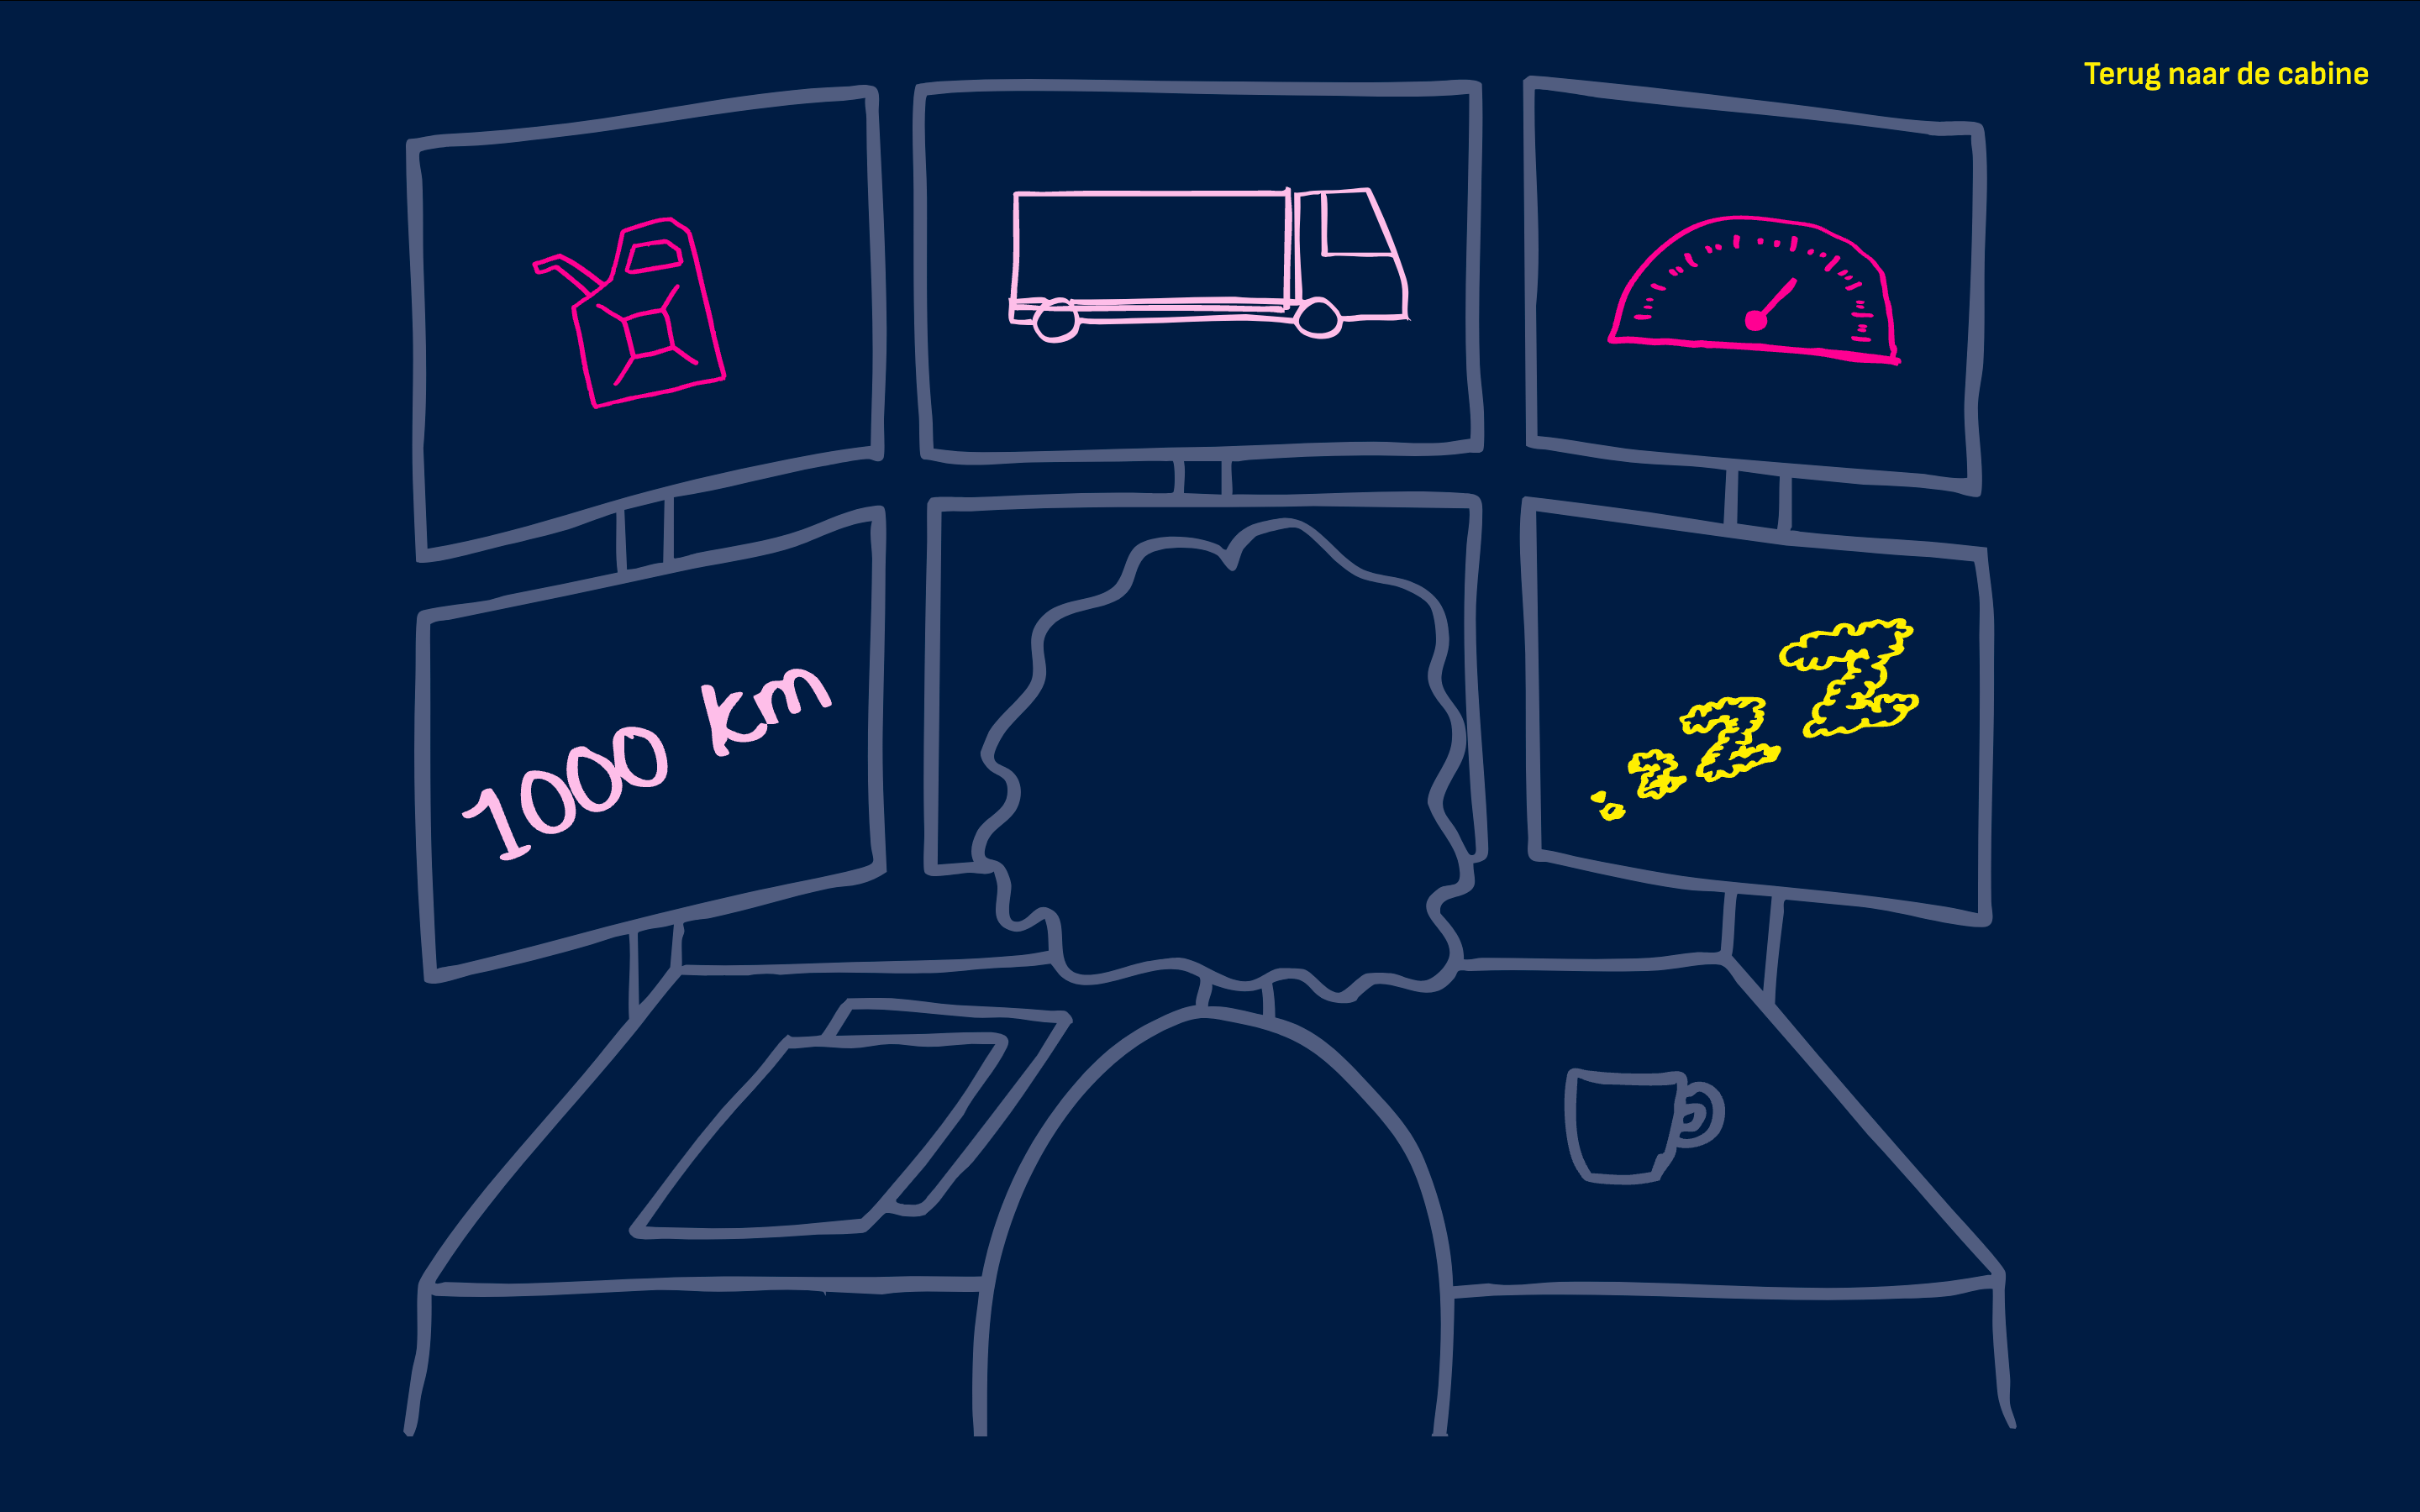
We wanted to make transit data more engaging, so we created an interactive experience where users explore a virtual truck, clicking on objects to uncover hidden stories. I turned complex numbers into visuals.
The hidden stories behind the transit data remain unnoticed because people only read the figures when absolutely necessary, not for enjoyment.
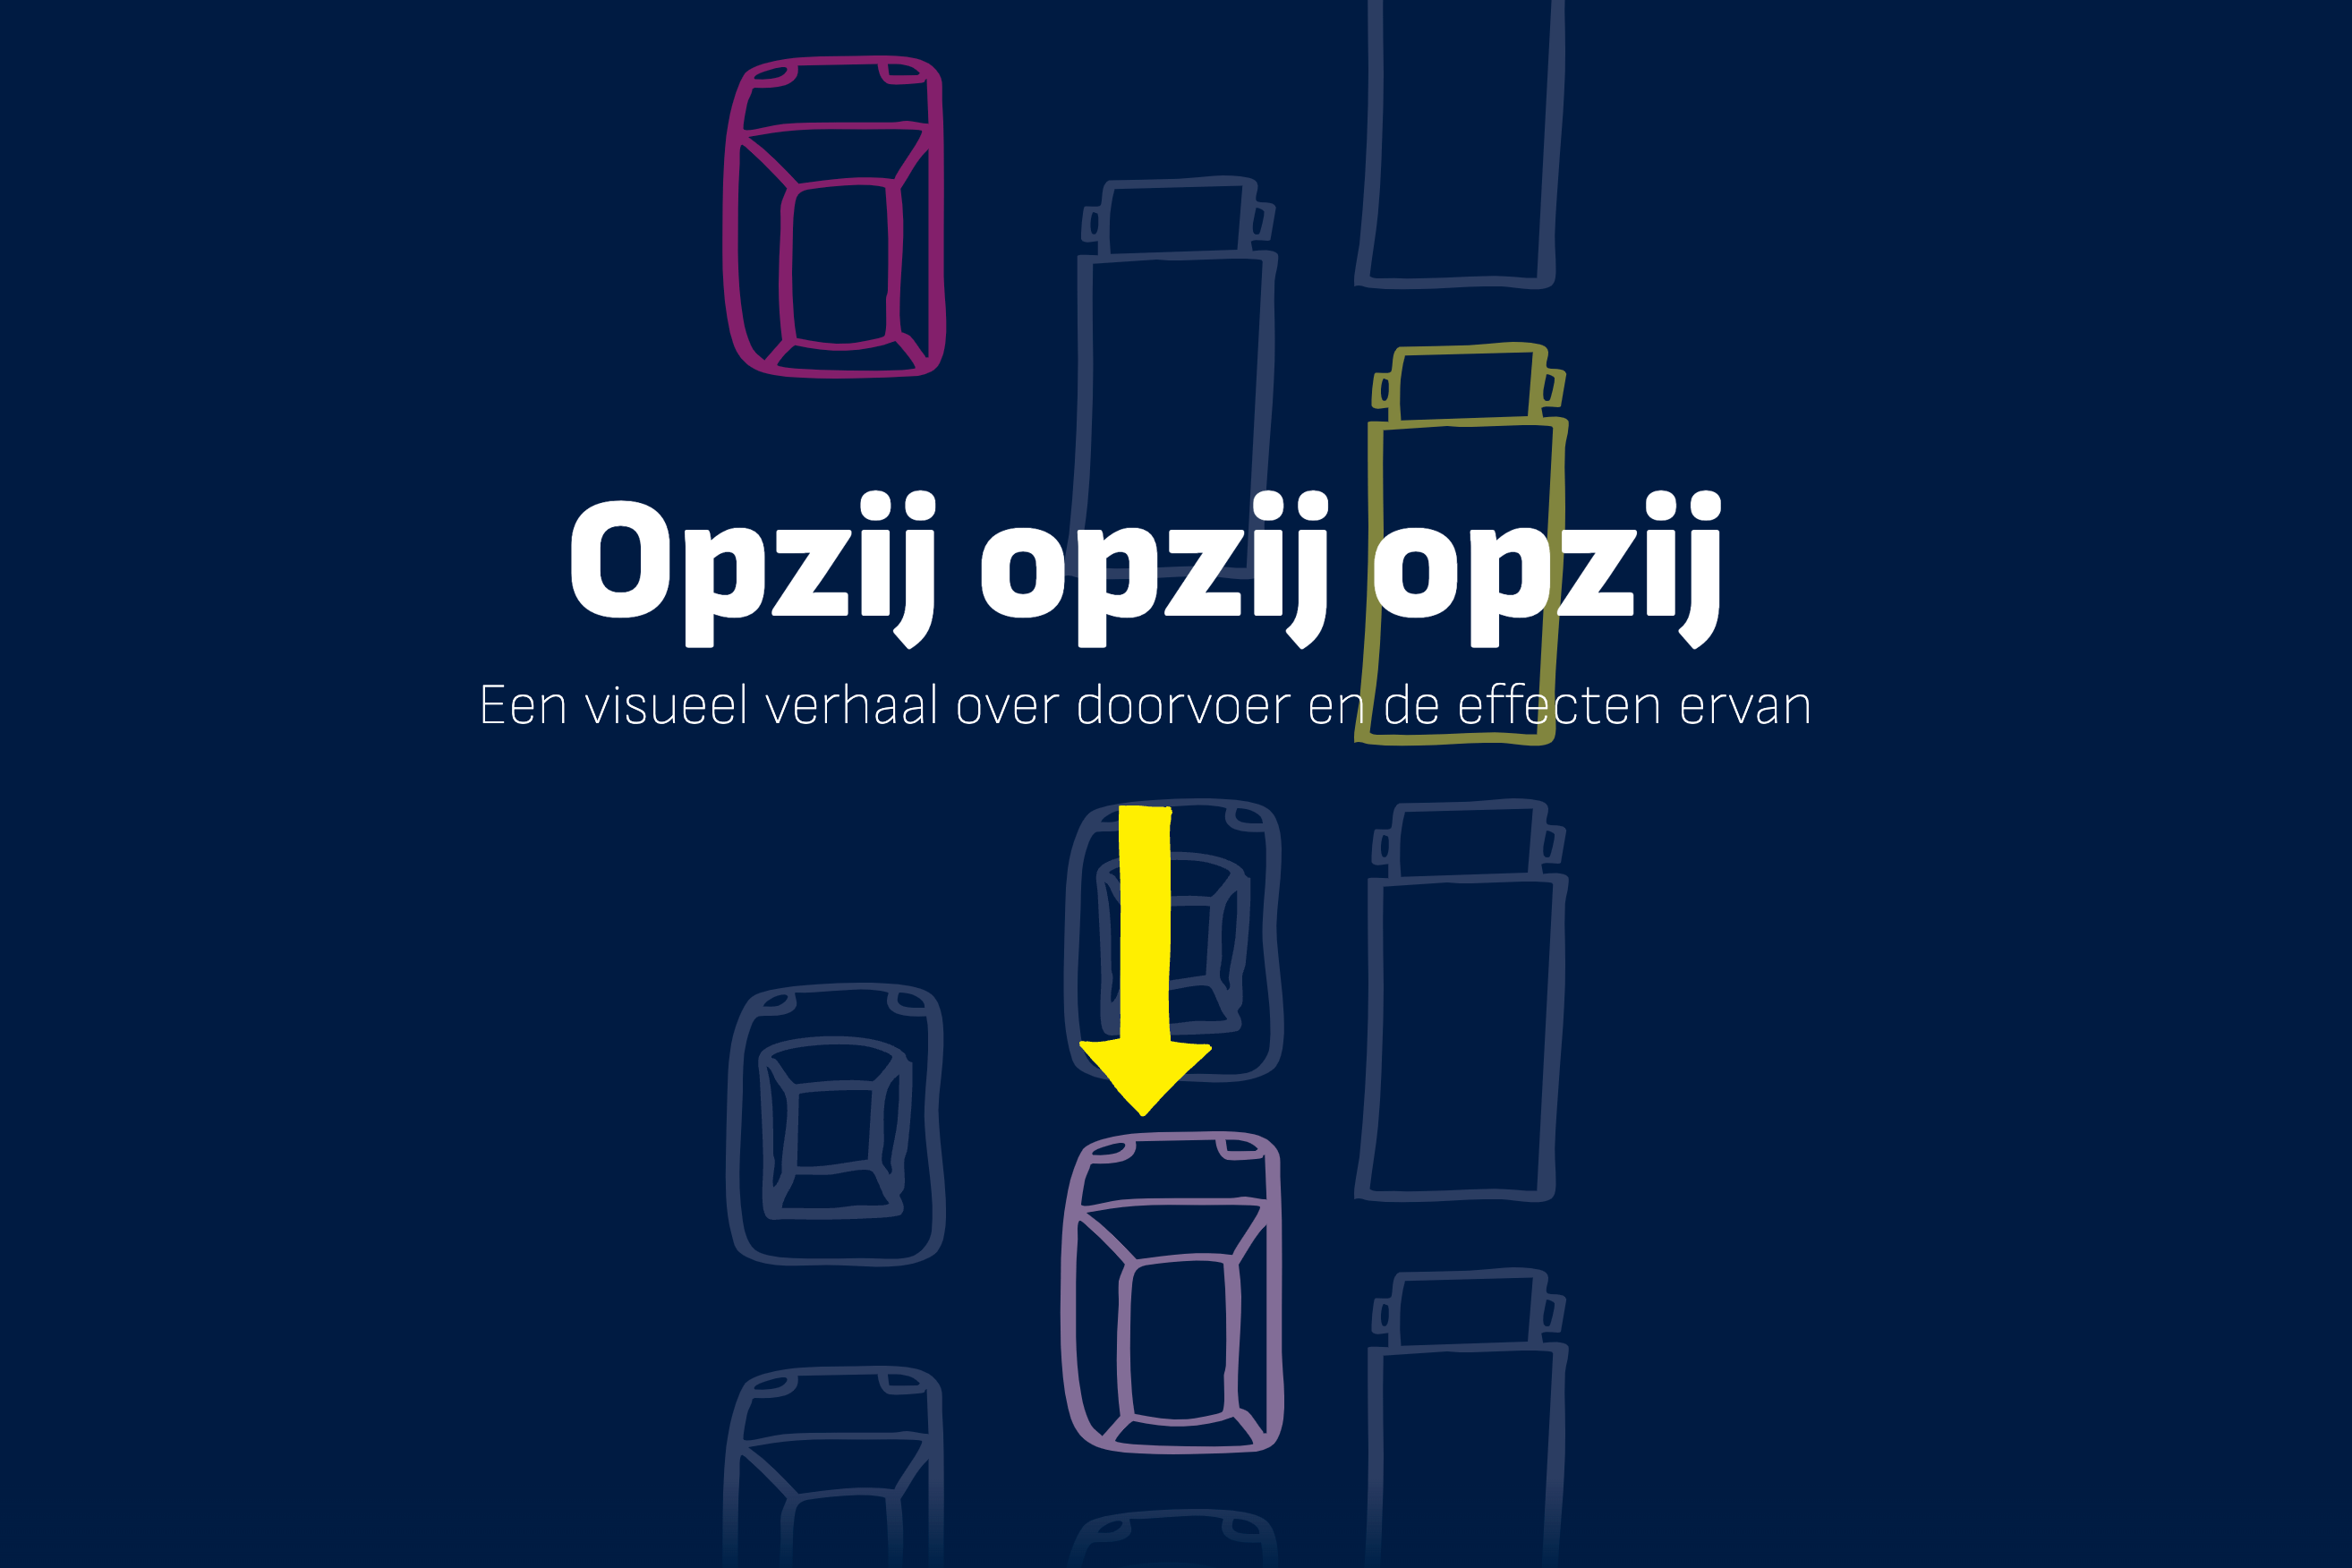
A multimedia story that brings these hidden narratives to life, making the data engaging and accessible through interactive visuals, storytelling, and immersive elements.
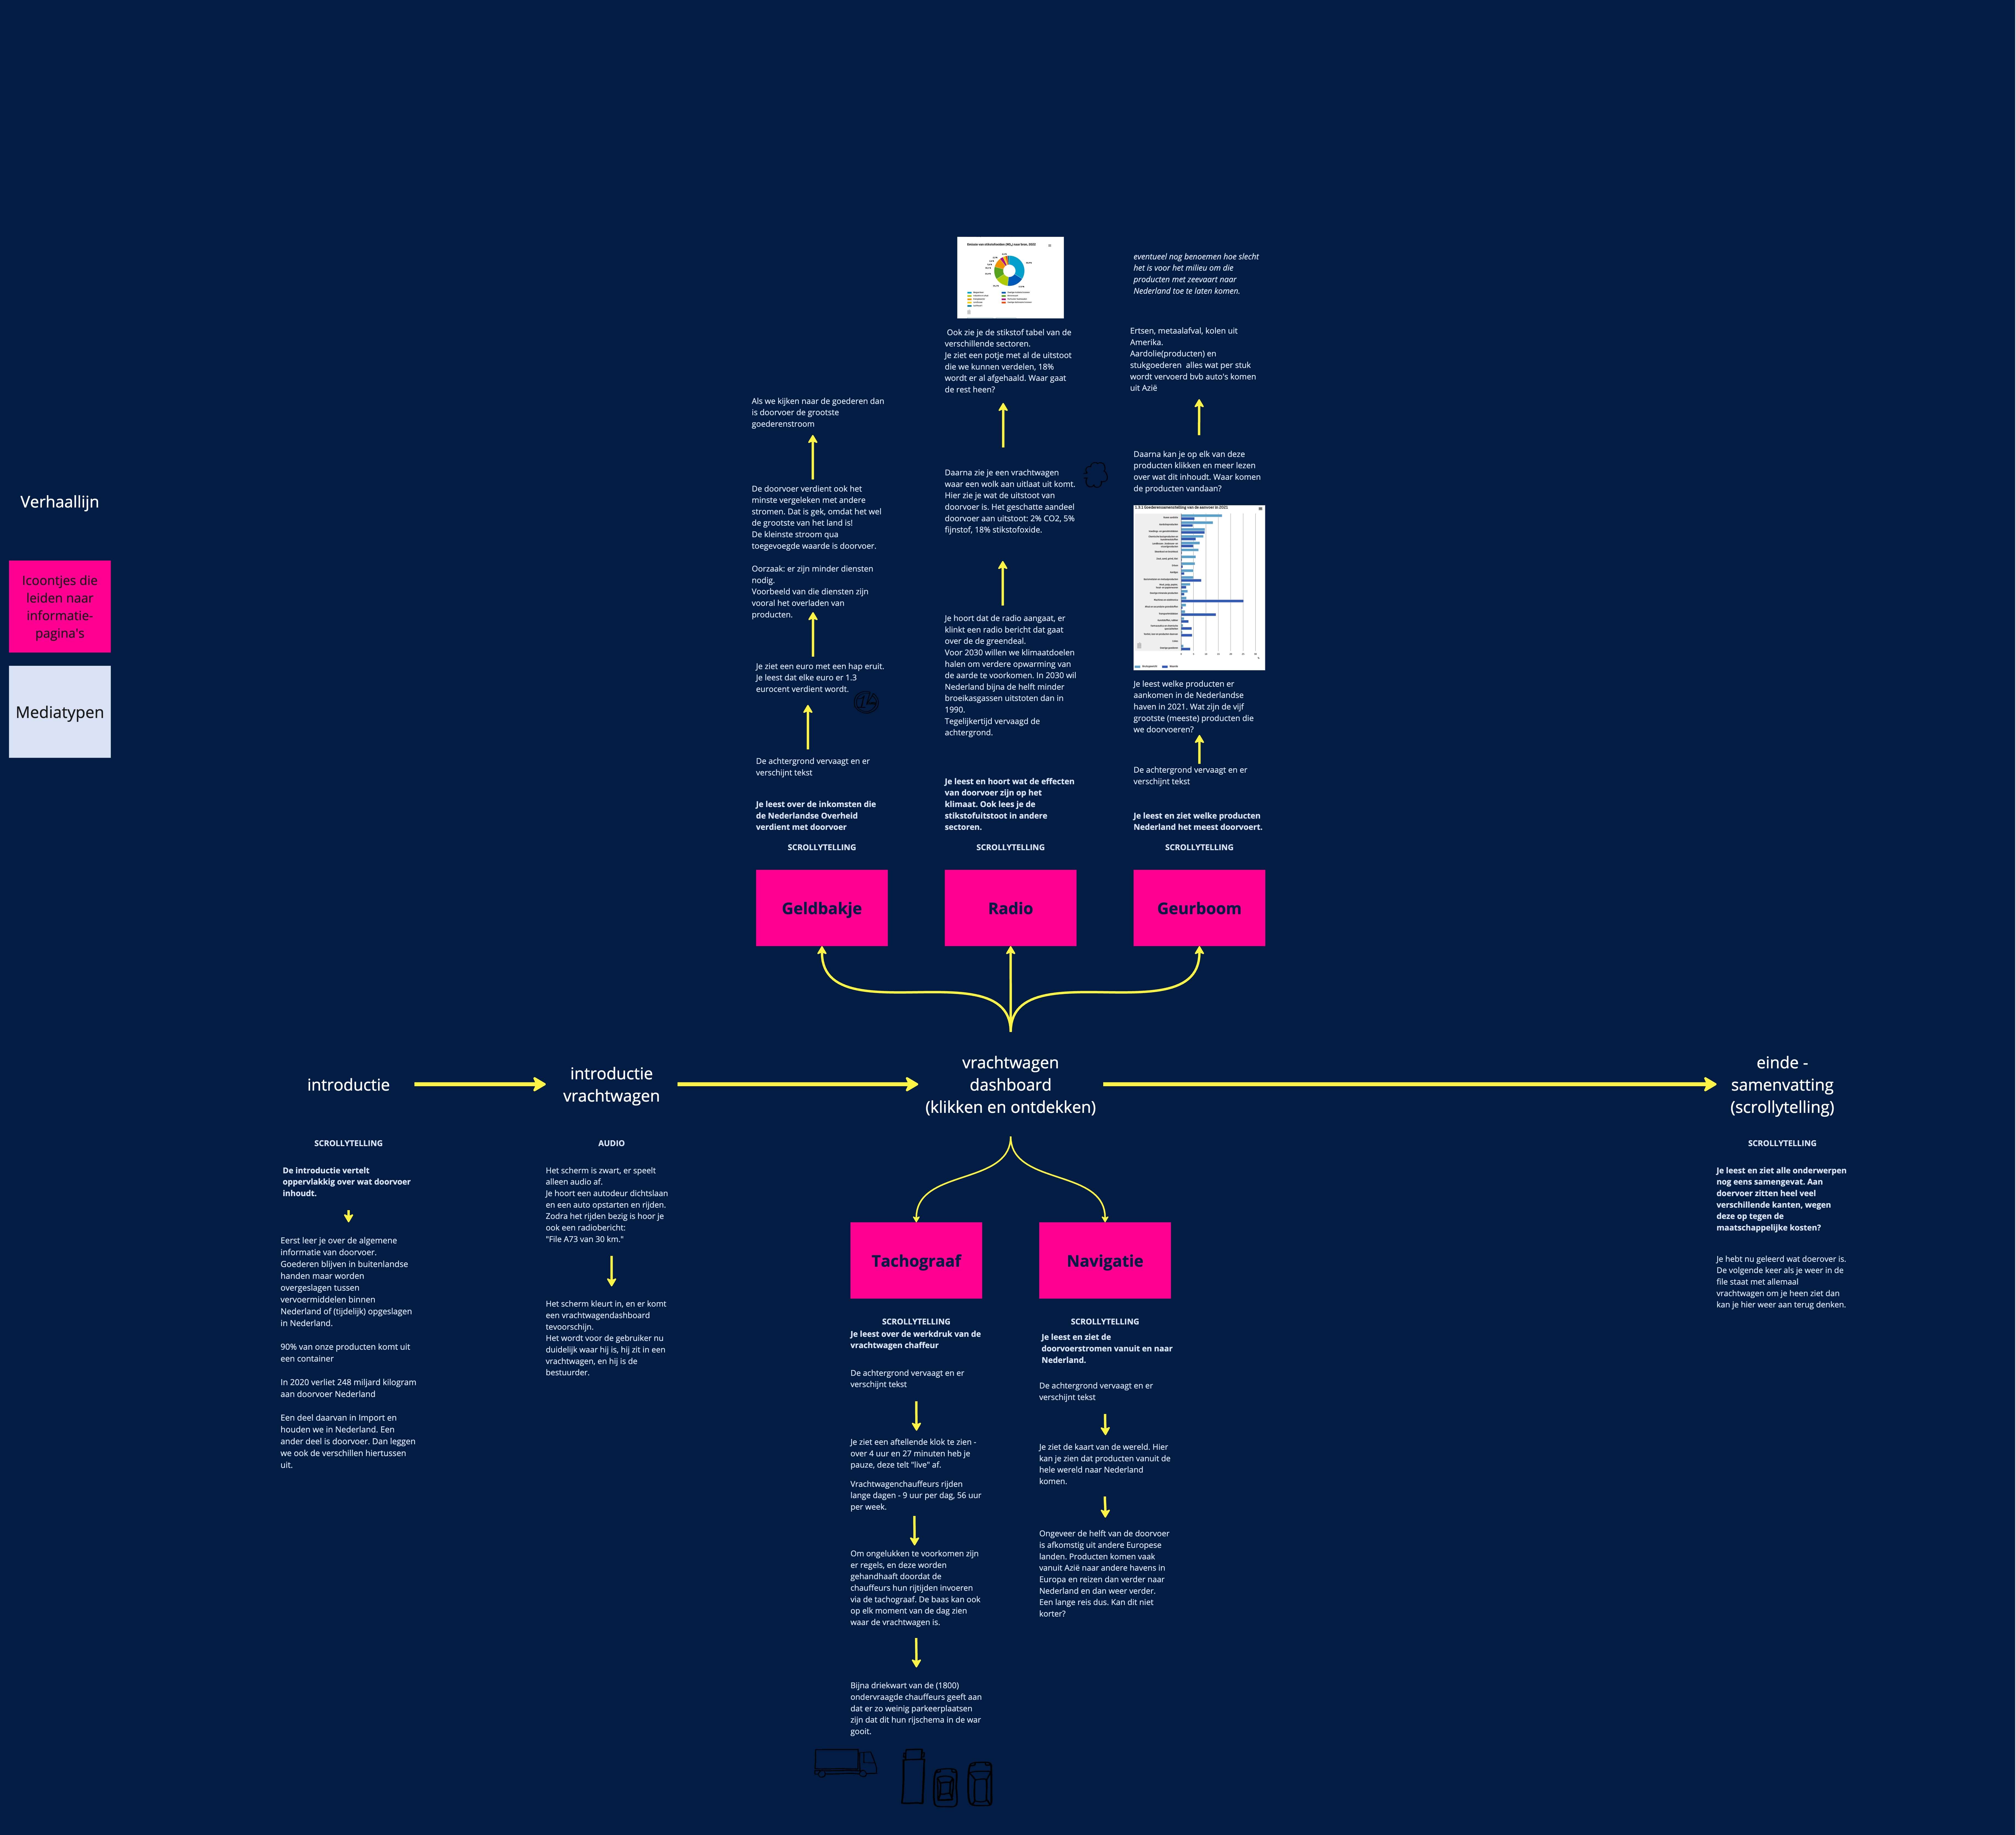
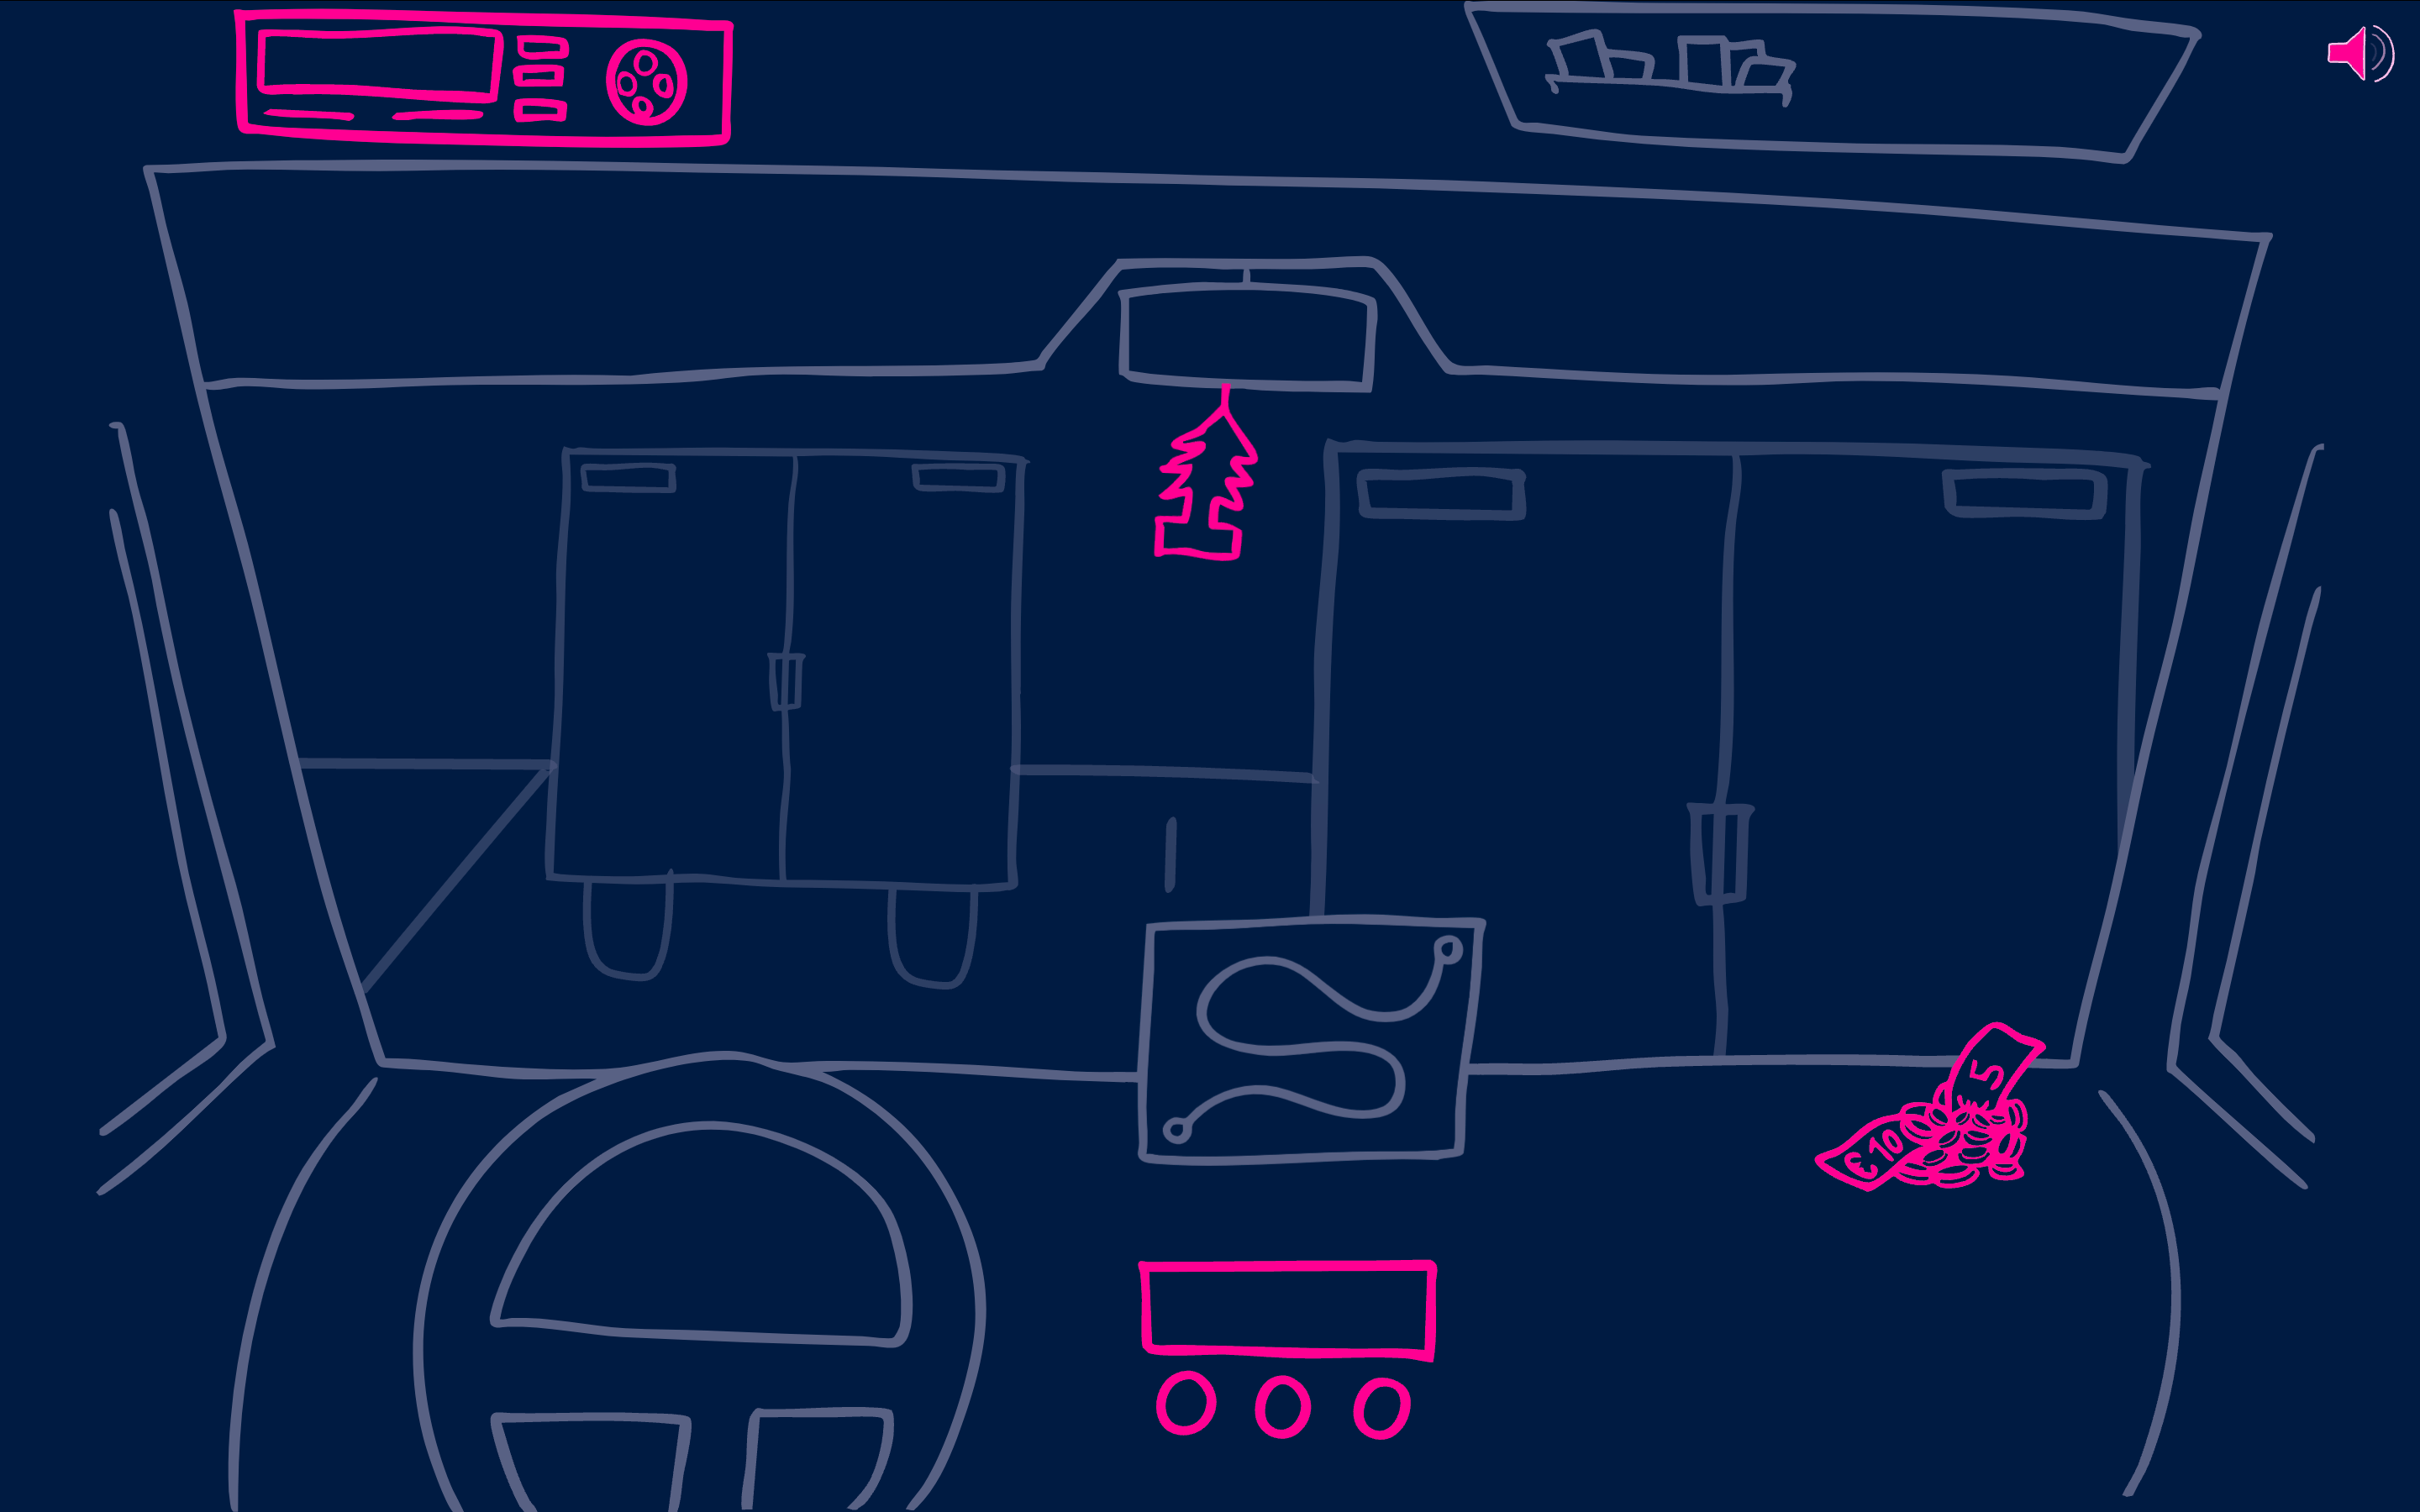
We started by creating a storyline based on the facts and sketching numerous ideas. We developed a story flow that begins with an introduction, where you learn a little bit about transit in the Netherlands. Then, the screen takes you inside a truck driving through the Netherlands. Inside the truck, you can click on multiple objects to learn more in-depth about specific aspects. We designed it this way because many people are unaware of what transit traffic is and why it’s a problem. By providing information on various aspects, we allow users to form their own conclusions.
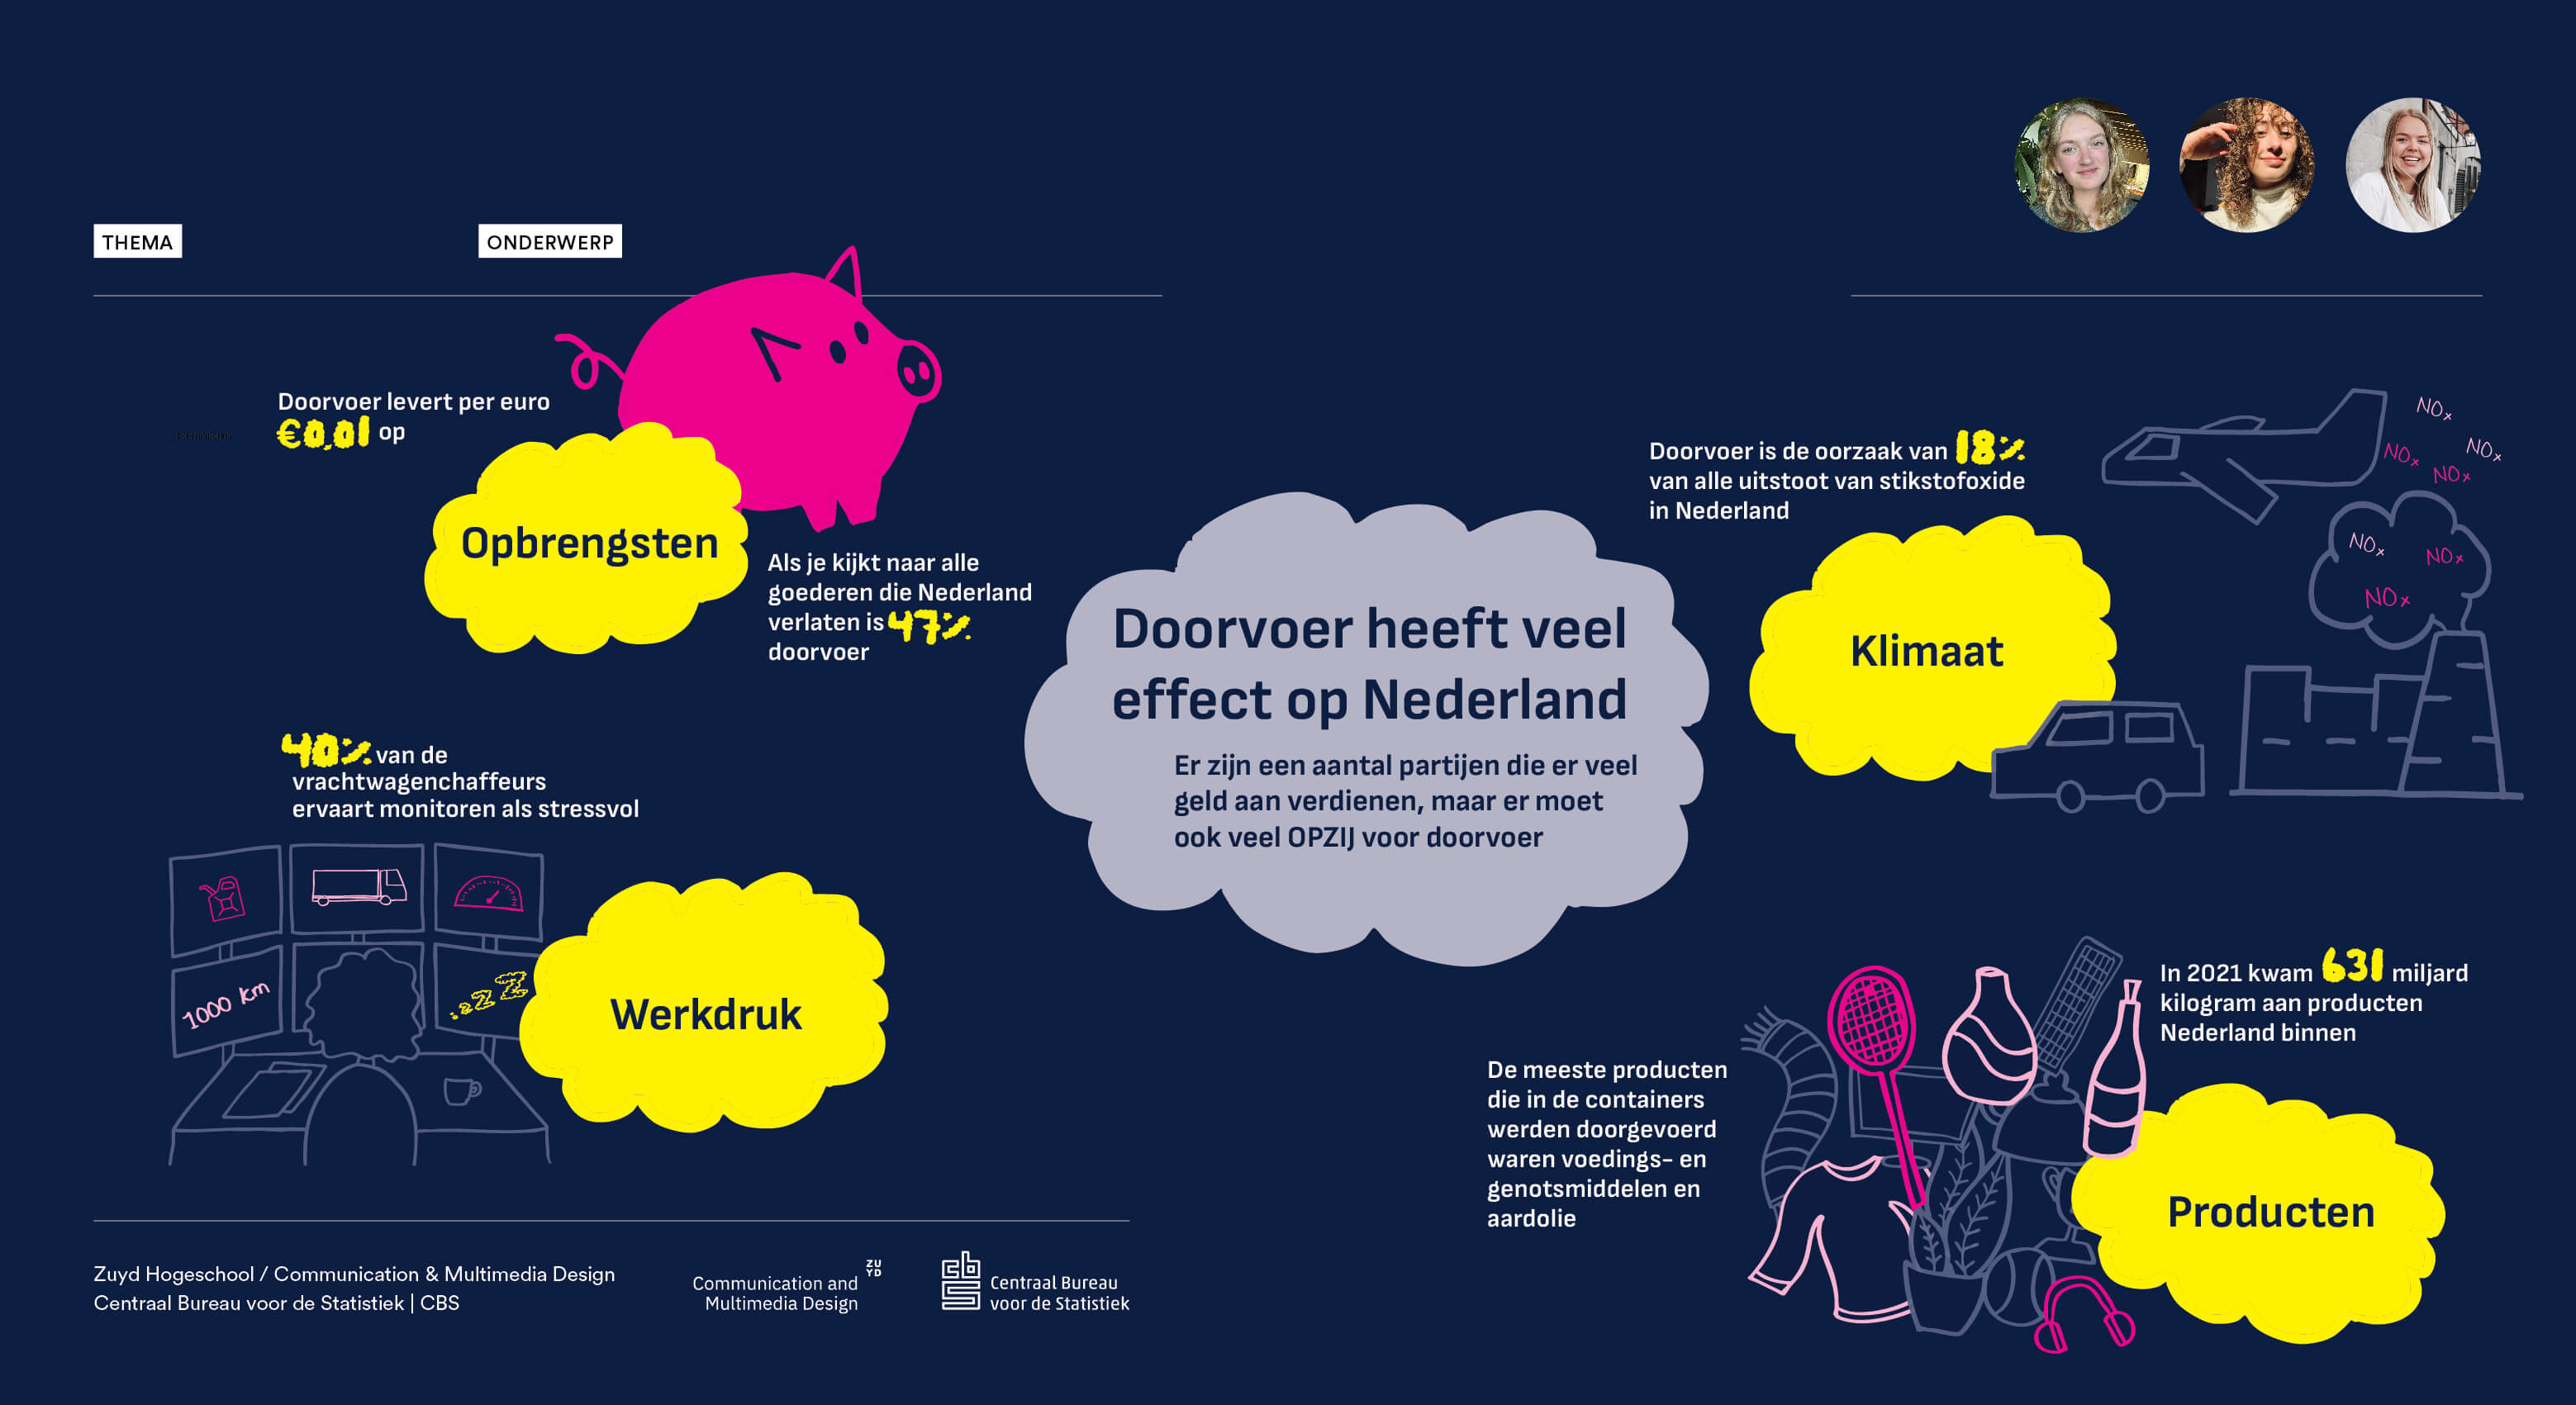
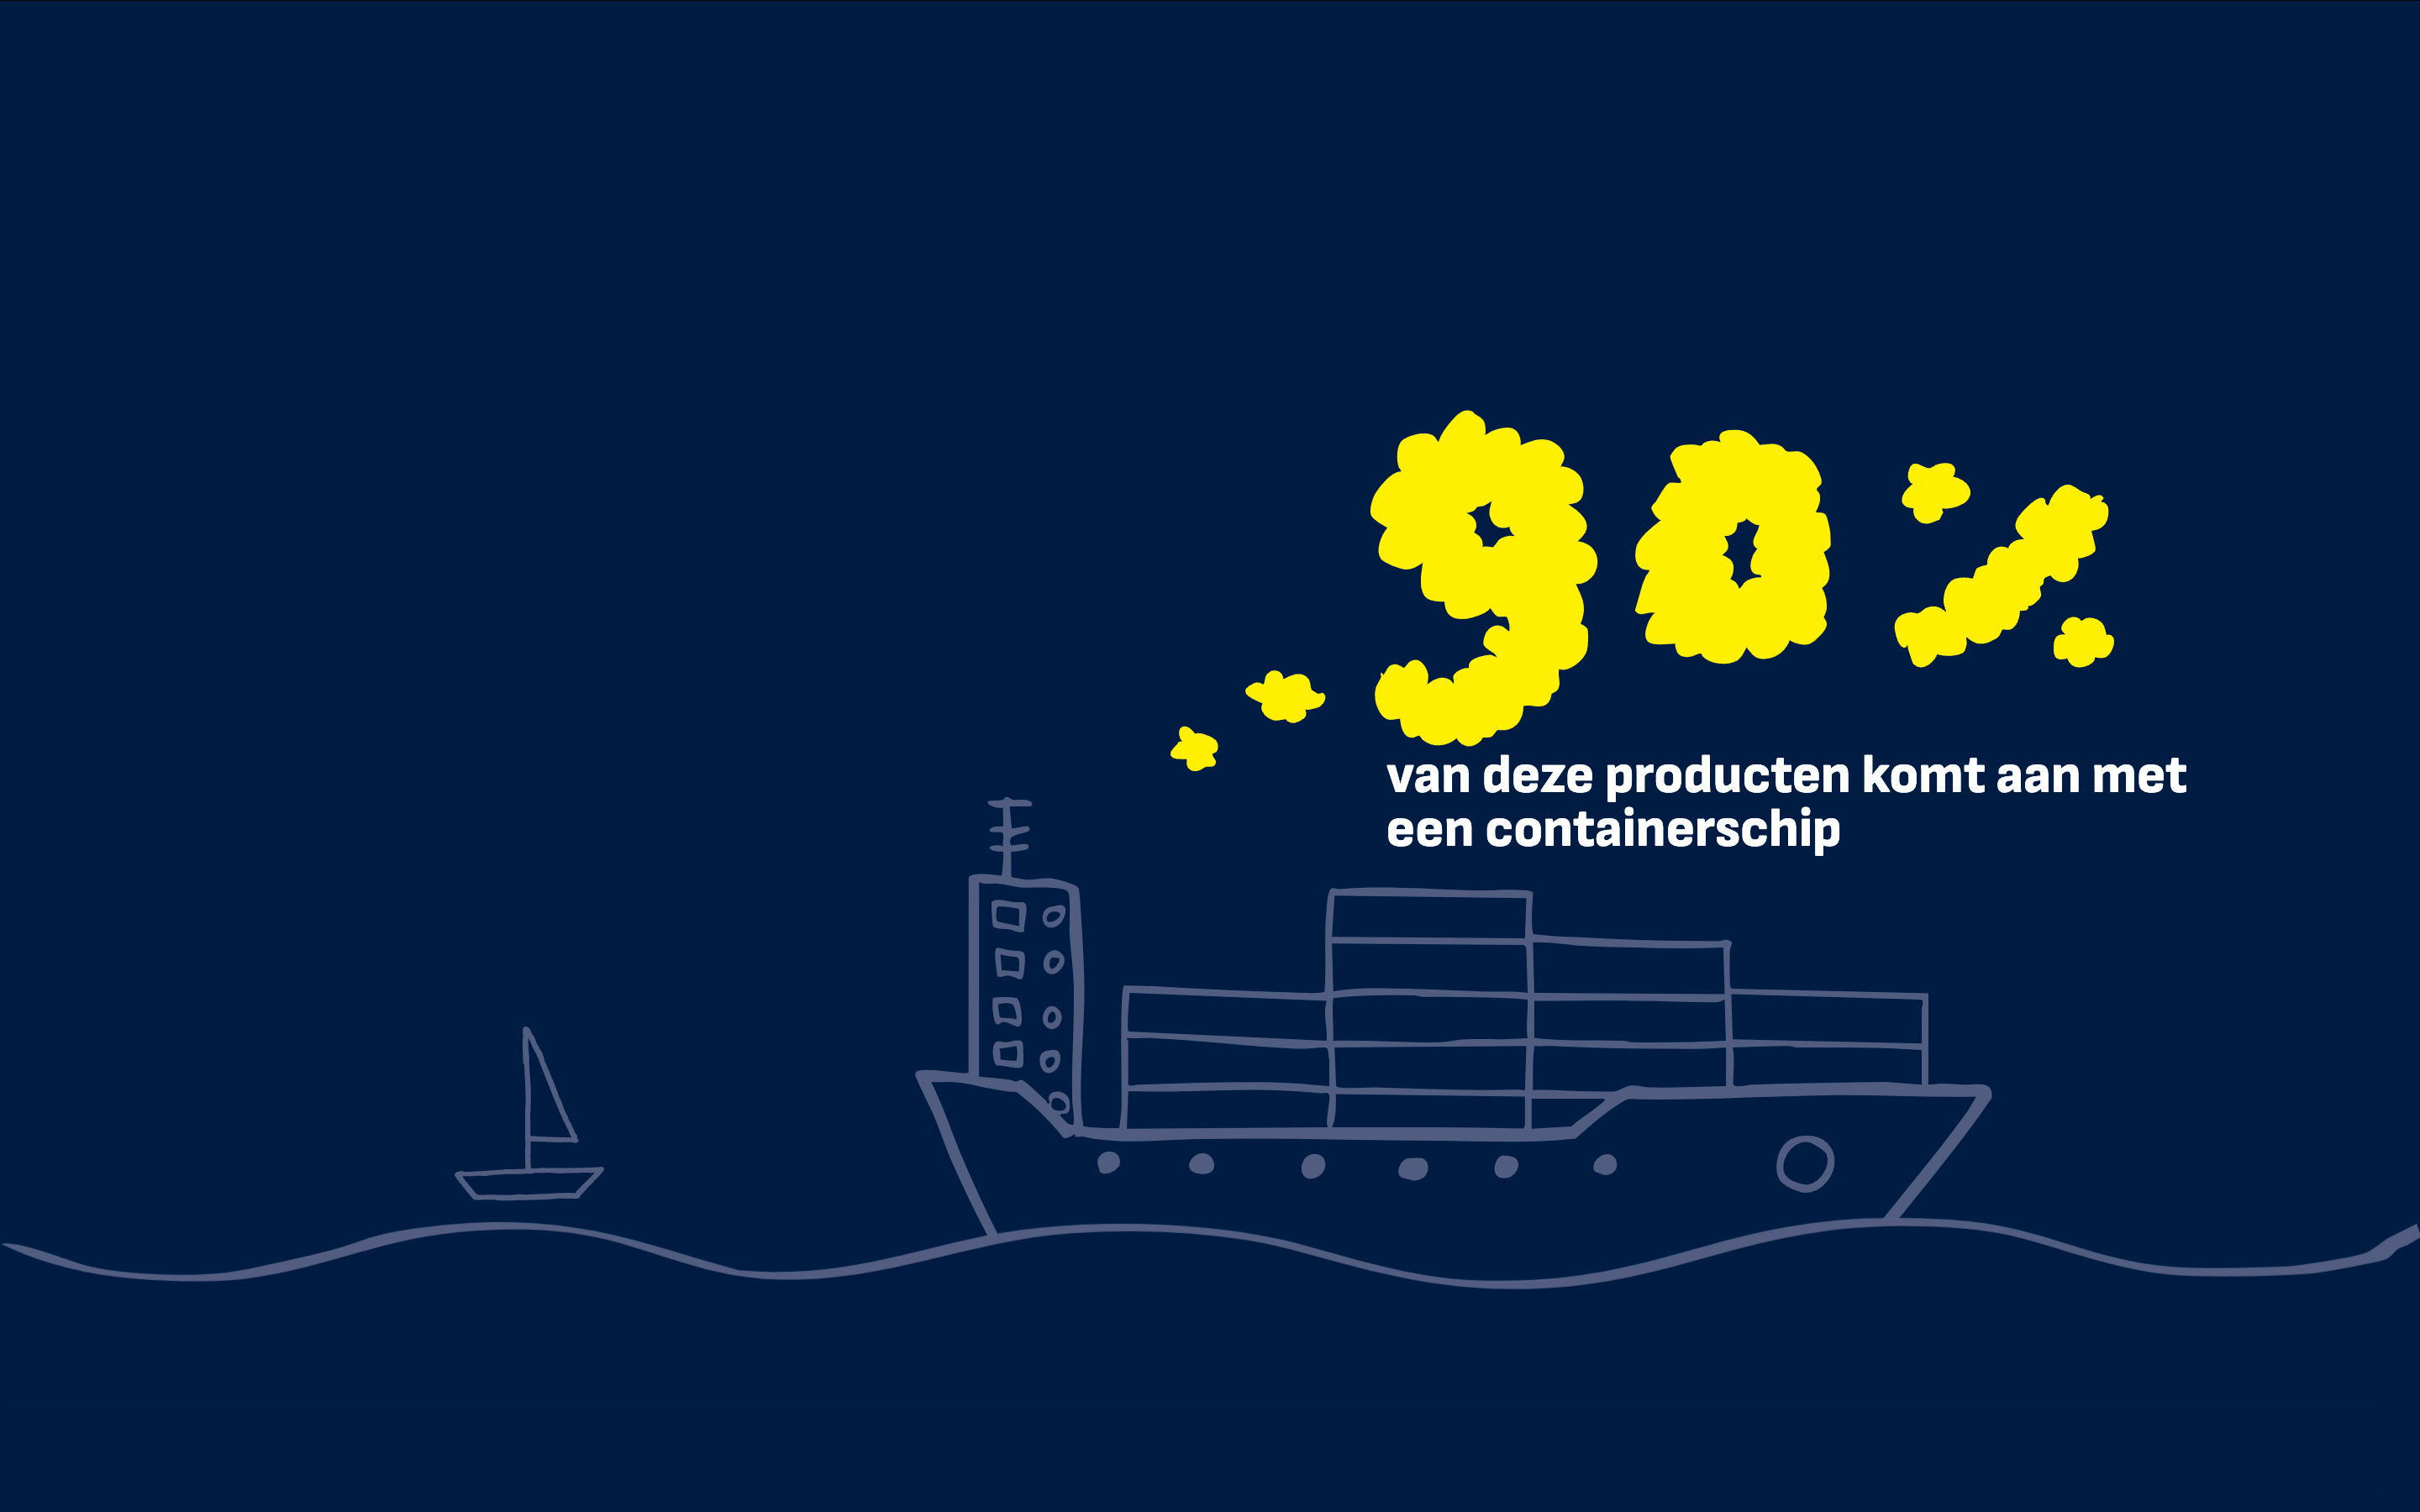
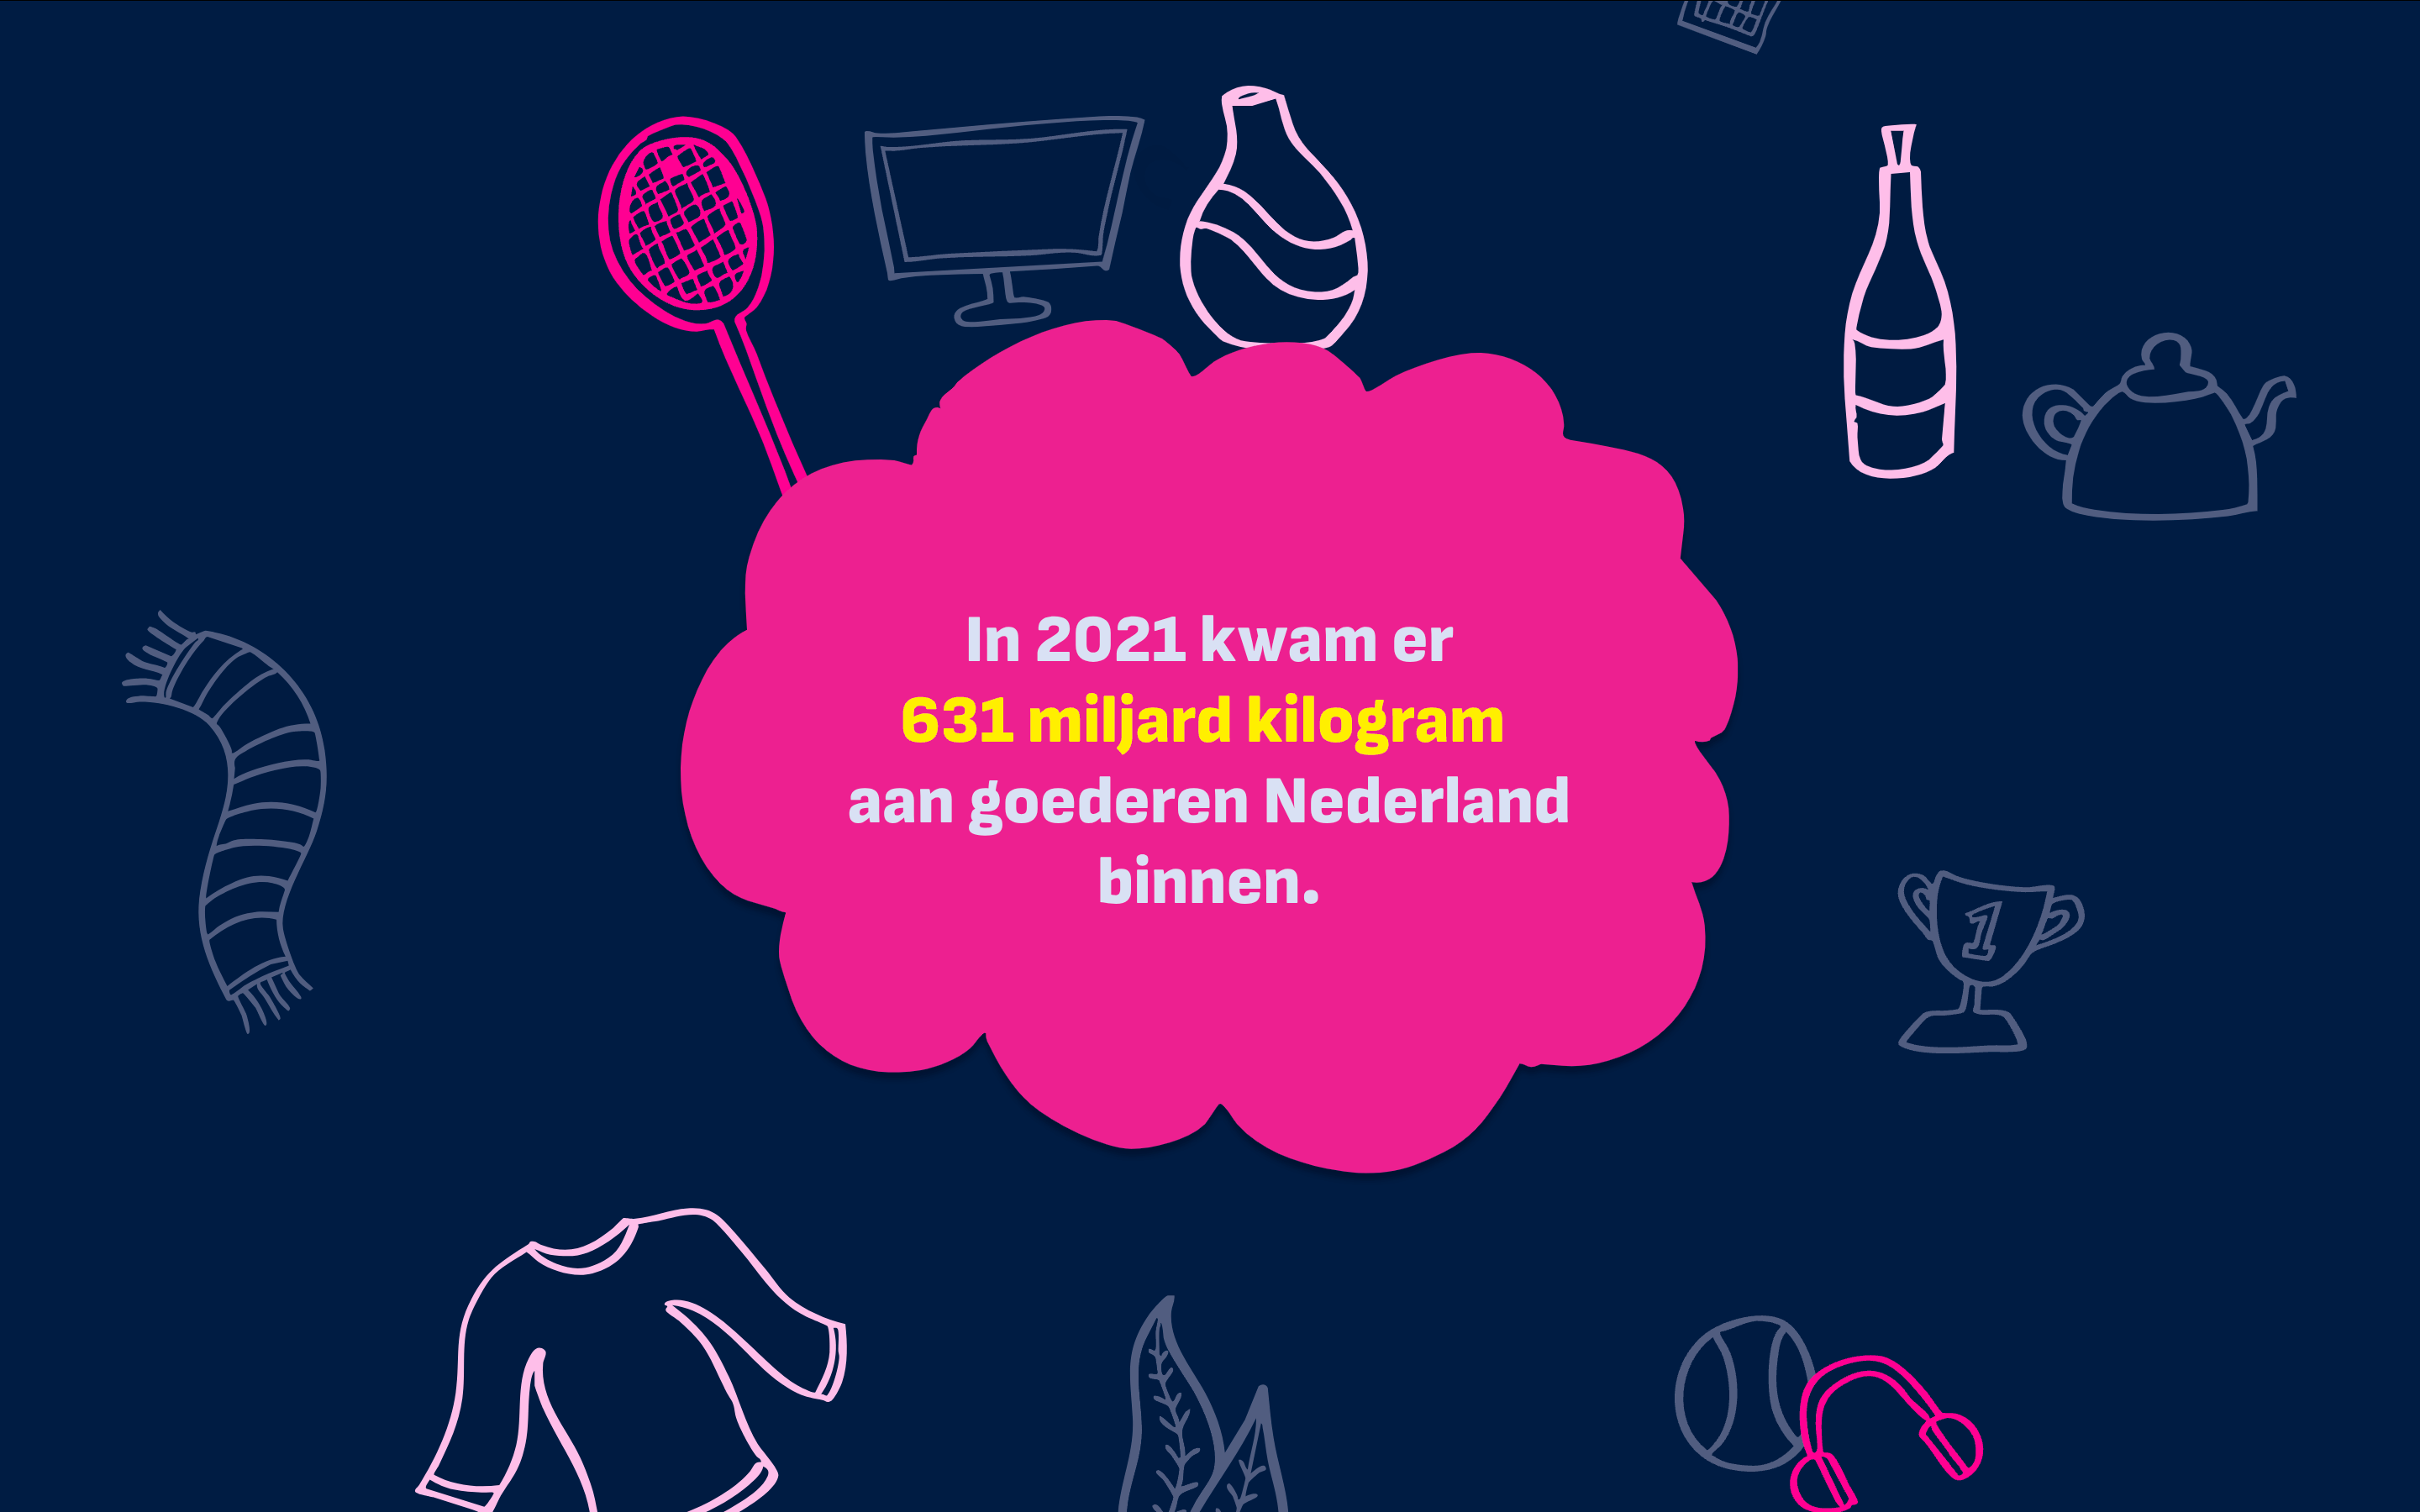
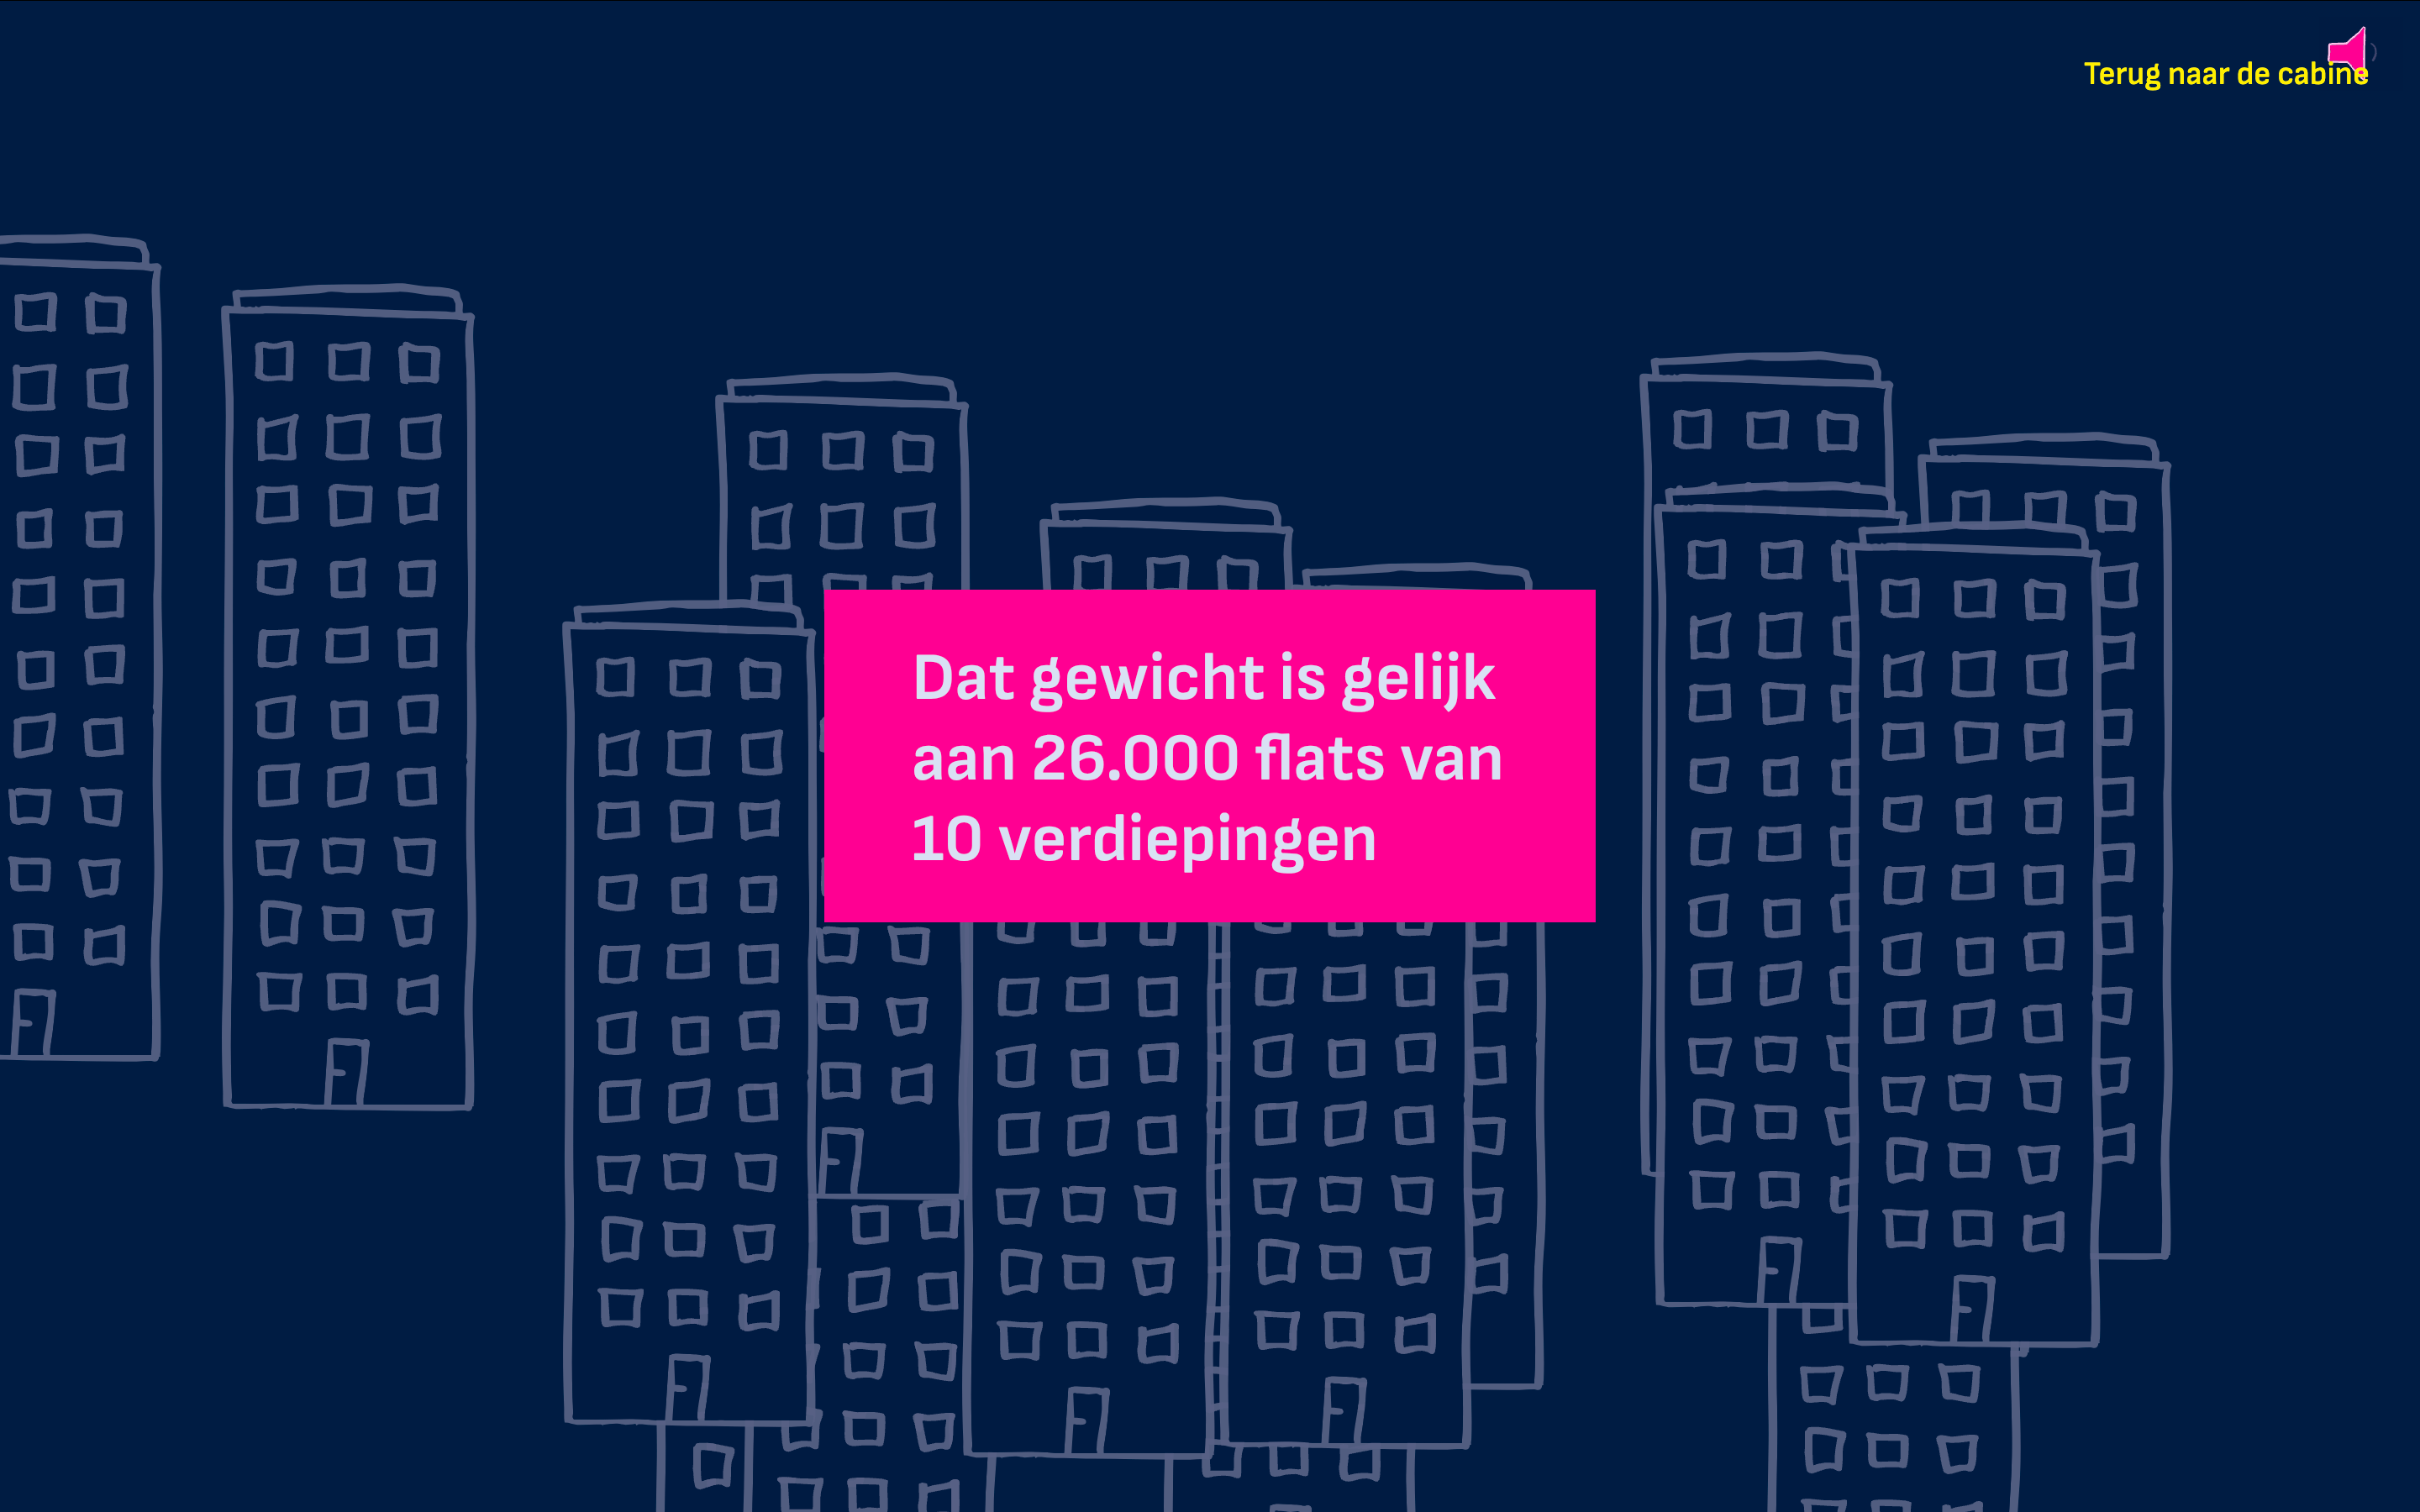
I was in charge of transforming the data into data visualizations and concepts. It was an amazing experience. For example, 631 billion kilograms of goods entered the Netherlands, which is equivalent to 26,000 ten-story apartment buildings.
At the end, we presented our work to the entire team at CBS in Heerlen, which was an incredible opportunity. Throughout the process, we collaborated with some of their team members, but presenting our work to those who handle this data on a daily basis and receiving their positive feedback was truly fantastic.