I've been creative for as long as I can remember—drawing, coloring, looming, sewing. When my father started a photography course during my early high school years and Photoshop appeared on his laptop, I was immediately intrigued. I followed YouTube tutorials on photo editing and started taking pictures of animals, even creating a book filled with dog portraits. This passion led me to study photography as my first major. During that program, we also had courses in Graphic Design and 3D, and I quickly realized that I enjoyed those even more than photography. That’s when I decided to switch to Communication and Multimedia Design (CMD). In my free time, I love knitting. It’s a slow craft, and I enjoy immersing myself in something that takes time to create.

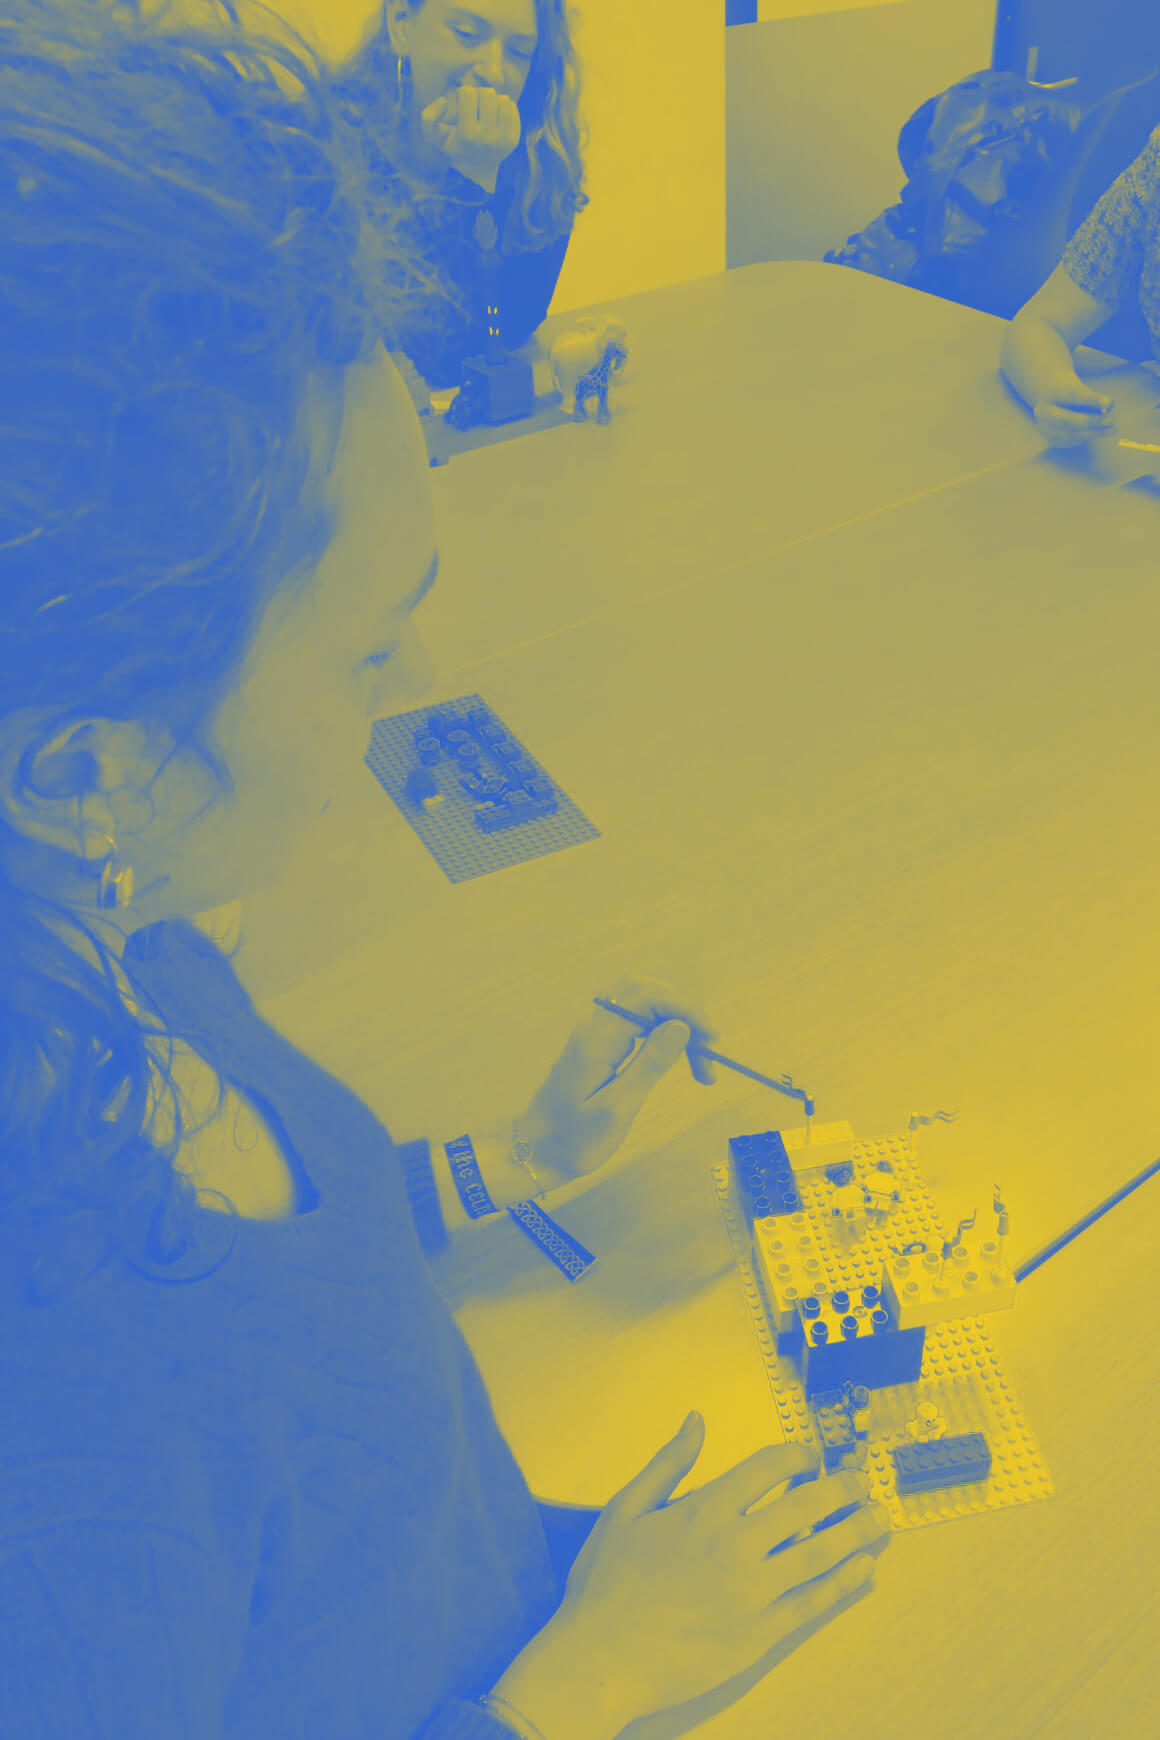
Lego serious Play
My background in photography has given me a deep understanding of visual composition, lighting, and
storytelling. But over time, I discovered that my true passion lies in other areas of design.
I have experience with various design tools, including Photoshop, Illustrator, Figma,
InDesign, HTML and CSS. While having technical skills is valuable, I believe
that design is about much more than just the tools.
What truly excites me is understanding people. I find it interessting to empathize with different
audiences, recognize patterns, and make meaningful connections.
This is also why I’m drawn to the Bauhaus philosophy. Bauhaus design is about functionality,
clarity, and reducing things to their essence. It combines art and technology in a way that
makes information accessible and beautiful. This approach deeply influences my work, especially
in data visualization, where simplifying complex information is key.
Recently, I’ve become fascinated by data visualization. This interest started during our visit to Ellery
Studio in Berlin. Their work in visual storytelling supports change, provides direction, and inspires
people to take action. One of their books, Future Ahoy! An Infographic Novel About Sustainable
Transport, showed me how data can be transformed into engaging and impactful visuals.
Following that experience, I worked on a project for the Dutch Central Bureau of Statistics (CBS), where
we created a multimedia story about logistics and transportation. This project was incredibly
fulfilling—I saw firsthand how data can tell compelling stories when presented effectively.
Now, I want to dive deeper into this field and explore how data visualization works in practice.
That’s why I’m looking for an internship where I can learn how these processes unfold in the real
world.